Showing posts with label temperature. Show all posts

Sunday, November 23, 2014

IPCC too conservative?


Earlier this month, the Intergovernmental Panel on Climate Change (IPCC) released its 5th Assessment Report (AR5), stating that: "Surface temperature is projected to rise over the 21st century under all assessed emission scenarios. It is very likely that heat waves will occur more often and last longer, and that extreme precipitation events will become more intense and frequent in many regions. The ocean will continue to warm and acidify, and global mean sea level to rise. Many aspects of climate change and associated impacts will continue for centuries, even if anthropogenic emissions of greenhouse gases are stopped. The risks of abrupt or irreversible changes increase as the magnitude of the warming increases."

That does sound scary. So, what would happen if the IPCC's projections are too conservative? Could humans, together with many other species, go extinct within the next few decades? What are the risks that this could eventuate? Below follows an assessment using graphics by Sam Carana.


1. Ocean Heat

Below is what the IPCC says:


Below is a graph produced by Sam Carana, based on NOAA data. For more background, see this earlier post.


2. Sea level Rise

The image below shows what the IPCC says.


If ocean heat will continues to rise as pictured in the image by Sam Carana, then thermal expansion alone will cause more sea level rise than foreseen by the IPCC. Furthermore, extensive melting on Antarctica and Greenland can result in additional sea level rise. Below is a sea level rise graph produced by Sam Carana, based on NASA/GSFCs data, as discussed in this earlier post.
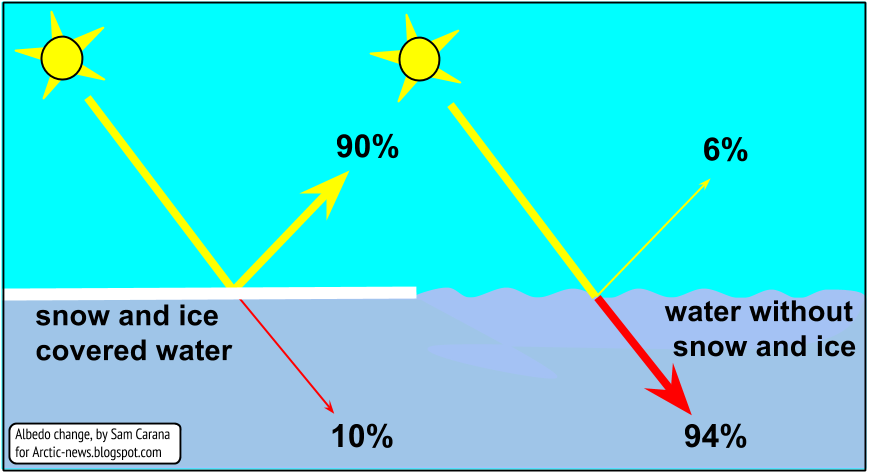


3. Arctic Sea Ice

The image below shows what the IPCC says.


If ocean heat will continues to rise as pictured in the image by Sam Carana, then Arctic sea ice will disappear much earlier than anticipated by the IPCC. An exponential trendline based on sea ice volume observations shows that sea ice looks set to disappear in 2019, while disappearance in 2015 is within the margins of a 5% confidence interval, reflecting natural variability.


A linear trend would be inappropriate, given the growing impact of feedbacks that can each be expected to reinforce sea ice decline, while there can also be interaction between these feedbacks, further accelerating sea ice decline. Albedo change is one such feedback, but there are numerous other ones, such as storms that have more chance to grow stronger as the area with open water increases.

In conclusion, an exponential trendline is more appropriate than a linear trendline, as also illustrated by above comparison, which shows that a linear trendline has 9 years fall outside its 95% confidence ionterval, versus 4 years for an exponential trendline. as discussed at the FAQ page.

Rapid decline of the snow and ice cover on the Northern Hemisphere is furthermore supported by rapidly rising surface temperatures over the Arctic, as well as greater intensity of heatwaves. Below is what the IPCC says on this.


Before further discussing surface temperatures, let's look into one of the feedbacks that could hugely increase temperatures, methane.


4. Methane

The IPCC appears to underestimate of the amount of methane that is contained in sediments under the Arctic Ocean and prone to be released as temperatures rise, as discussed in this earlier post and in this earlier post.

The image below, based on data from the IPCC and the World Metereological Organization (WMO), with an added observation from a NOAA MetOp satellite image, illustrates the recent rise of methane levels and the threat that methane levels will continue to rise rapidly.


When looked at from a longer range of years, above image fits in the black square on the image below.


As ocean heat keeps increasing and warming in the Arctic keeps accelerating due to feedbacks such as Arctic sea ice decline, huge methane eruptions from the seafloor of the Arctic Ocean threaten to push up methane levels even further. The image below shows exponential rise based on data of East Siberian Arctic Shelf (ESAS) releases alone, as discussed in an earlier post.


Non-linear rise is supported by the fact that methane's lifetime increases as more methane enters the atmosphere.


5. Surface Temperatures

The IPCC expects that, worst case, global average temperature could rise by 13 degrees Celsius by 2300, as illustrated by the image below.


The situation could be much worse than foreseen by the IPCC, due to the non-linear way feedbacks can hugely increase temperature rises.


The threat is that such rapid temperature rises will appear at first in hotspots over the Arctic and eventually around the globe, while also resulting in huge temperature swings that could result in depletion of supply of food and fresh water, as further illustrated by the above image, from an earlier post, and the image below, from another earlier post.


The situation is dire and calls for comprehensive and effective action, as discussed at the Climate Plan blog.


Thursday, November 20, 2014

Ocean Temperature Rise Continues


Ocean Temperature Rise

Of all the excess heat that results from people's emissions, 93.4% goes into oceans. Accordingly, the temperature of oceans has risen substantially.

NOAA analysis shows that the most recent 12-month period, November 2013–October 2014, broke the record (set just last month) for the all-time warmest 12-month period in the 135-year period of record. The global oceans were the warmest on record for October. For January–October, the average global sea surface temperature was also record high.


The danger is that ocean temperatures will continue to rise, especially in the North Atlantic, and that the Gulf Stream will keep carrying ever warmer water from the North Atlantic into the Arctic Ocean, threatening to unleash huge methane eruptions from the Arctic Ocean's seafloor, in turn causing even higher temperatures and more extreme weather events, wildfires, etc.


High Methane Levels

High methane levels were recorded over the Arctic Ocean in October, as discussed in this earlier post, and were sustained in November, as discussed in this post. Methane levels as high as 2717 ppb were recorded on November 16, 2014, p.m, by the MetOp-1 satellite at 469 mb (i.e. 19,820 ft or 6,041 m altitude), as the image below shows.

Methane levels as high as 2549 ppb were recorded on November 19, 2014, p.m, by the MetOp-2 satellite at 586 mb (i.e. 14,385 ft or 4,384 m altitude), as the image below shows.

Above image further confirms earlier indications that these high methane levels do indeed result from large methane eruptions from the seafloor of the Arctic Ocean.

Greenhouse gas levels in general are very high over the Arctic, as earlier discussed in a recent post and as illustrated by the image below, showing carbon dioxide levels as high as 420 ppm at high latitudes, while the global mean was 403 ppm, on November 19, 2014, p.m., at 945 mb (i.e. 1,916 ft or 584 m altitude).


As said, sustained instances of large abrupt methane eruptions from the seafloor of the Arctic Ocean threaten to strongly accelerate warming in the Arctic even further, in turn resulting in ever more methane being released, as illustrated in the image below, from an earlier post.


Self-reinforcing Feedback Loops


Such methane eruptions are part of a number of self-reinforcing feedback loops that can strongly accelerate warming in the Arctic. Above image, from an earlier post, illustrates two such feedbacks, i.e. albedo changes due to snow and ice demise, and methane releases. Further feedbacks are described in this post and this post, and in the image below.

For a discussion of these and further feedbacks, see this page at the Climate Plan blog 
The threat is that such rapid temperature rises will appear at first in hotspots over the Arctic and eventually around the globe, while also resulting in huge temperature swings that could result in depletion of supply of food and fresh water, as further illustrated by the above image, from an earlier post, and the image below, from another earlier post.
[ click on image at original post to enlarge ]


IPCC warnings not strong enough


In above paragraph, the IPCC warns about the risk of methane eruptions from the seafloor of the Arctic Ocean further accelerating global warming. While the IPCC does model for a temperature rise that could exceed 12 degrees Celsius in a 'business as usual' scenario (i.e. without action taken), the IPCC does not anticipate that such a rise could occur before the year 2250, as illustrated by the image below.


The situation could be much worse than foreseen by the IPCC, due to a number of reasons, including:
  1. The non-linear way feedbacks can hugely increase temperature rises.
  2.  The IPCC's underestimation of the amount of methane contained in sediments under the Arctic Ocean and prone to be released as temperatures rise. Shakhova et al. estimate the accumulated methane potential for the Eastern Siberian Arctic Shelf (ESAS) alone as follows:
    - organic carbon in permafrost of about 500 Gt;
    - about 1000 Gt in hydrate deposits; and
    - about 700 Gt in free gas beneath the gas hydrate stability zone.
    Back in 2008, Shakhova et al. considered release of up to 50 Gt of predicted amount of hydrate storage as highly possible for abrupt release at any time.
    Furthermore, mantel methane could add to our predicament, as discussed in an earlier post.
  3. Back in 2002, Malcolm Light already warned that seismic events could trigger destabilization of methane hydrates. Furthermore, huge temperature swings can combine with pressure swings and storms, and with swings between expansion and contraction of soil and ice, resulting in severe shocks to ecosystems, as described in an earlier post
  4. The IPCC's ignoring of large methane eruptions from the seafloor of the Arctic Oceans and the resulting growth of mean global methane levels at higher altitudes, as discussed in an earlier post.
Steven Sherwood et al. wrote back in 2010 that peak heat stress, quantified by wet bulb temperature, across diverse climates today never exceeds 31 degrees Celsius (see also this update). Some may believe that this doesn't apply to the Arctic and the higher altitudes in mountain regions. However, at the June Solstice the amount of solar radiation received in the Arctic is higher than anywhere else on Earth, An increased occurence and intensity of heatwaves could expose large areas of the Arctic and mountain regions to sustained heatwaves exceeding peak heat stress temperatures. In addition, ocean acidification and oxygen depletion in the Arctic Ocean would make it hard for fish, seals, polar bears and further wildlife to survive. Furthermore, the short growth season combined with a long, cold winter limits vegetation in the Arctic, while ecosystems are also becoming increasingly exposed to wild weather swings and wildfires.


Risk Assessment

When taking above points into acount, an absence of action seems to guarantee human extinction by the year 2050. Little action will be ‘too little, too late’ and will merely delay human extinction by a few years, as illustrated by the graph below.


The graph identifies the years 2030 and 2040 as critical. Beyond the year 2030, the risk that humans will go extrinct grows larger than 1% in the absence of action. By the year 2040, the risk of human extinction will have increased substantially, especially if no action will have been taken, but also if too little action will have been taken up to 2040, while even with the best possible programs put in place by the year 2015, there will be a 2% risk of human extinction by 2040, e.g. due to war over what action to take, or due to political opposition or errors making such programs ineffective or even counter-productive.

In conclusion, it is highly likely that the risk of human extinction already now is intolerably high and rising with every moment passing with little no action taken to reduce the risk. This calls for comprehensive and effective action, as further discussed at the Climate Plan blog.


References

- Intergovernmental Panel on Climate Change (IPCC) WGI Fifth Assessment Report (AR5), Final Draft (7 June 2013), page 168.
http://www.climatechange2013.org/images/uploads/WGIAR5_WGI-12Doc2b_FinalDraft_Chapter02.pdf

- Intergovernmental Panel on Climate Change (IPCC) WGI Fifth Assessment Report (AR5), Final Draft (7 June 2013), Figure 12.5.
http://www.climatechange2013.org/images/uploads/WGIAR5_WGI-12Doc2b_FinalDraft_Chapter12.pdf

- An adaptability limit to climate change due to heat stress - by Steven C. Sherwood & Matthew Huber
http://www.pnas.org/content/early/2010/04/26/0913352107.full.pdf

- Ocean Temperature Rise - by Sam Carana
http://arctic-news.blogspot.com/2014/10/ocean-temperature-rise.html

- Methane release from the East Siberian Arctic Shelf and the Potential for Abrupt Climate Change - by Natalia Shakhova & Igor Semiletov
http://symposium2010.serdp-estcp.org/content/download/8914/107496/version/3/file/1A_Shakhova_Final.pdf

- Anomalies of methane in the atmosphere over the East Siberian shelf: Is there any sign of methane leakage from shallow shelf hydrates? - by Shakhova, Semiletov, Salyuk & Kosmach  http://www.cosis.net/abstracts/EGU2008/01526/EGU2008-A-01526.pdf

- Mantle Methane - by Malcolm Light
http://arctic-news.blogspot.com/2014/02/mantle-methane.html

- Evidence linking Arctic amplification to extreme weather in mid-latitudes - by Jennifer A. Francis and S.J. Vavrus, in: Geophysical Research Letters 39 (6):. doi:10.1029/2012GL051000
http://onlinelibrary.wiley.com/doi/10.1029/2012GL051000/abstract

- Near-Term Human Extinction - by Sam Carana
http://arctic-news.blogspot.com/2014/04/near-term-human-extinction.html

- Warm waters threaten to trigger huge methane eruptions from Arctic Ocean seafloor - by Sam Carana
http://arctic-news.blogspot.com/2014/08/warm-waters-threaten-to-trigger-huge-methane-releases-from-arctic-ocean-seafloor.html

- How many deaths could result from failure to act on climate change? - by sam Carana
http://arctic-news.blogspot.com/2014/05/how-many-deaths-could-result-from-failure-to-act-on-climate-change.html

- Methane linked to Seismic Activity in the Arctic - by Malcolm P. Light & Sam Carana
http://arctic-news.blogspot.com/p/seismic-activity.html

- Wild Weather Swings - by Sam Carana
http://arctic-news.blogspot.com/2014/10/wild-weather-swings.html

- Four Hiroshima bombs a second: how we imagine climate change - by Sam Carana
http://arctic-news.blogspot.com/2013/08/four-hiroshima-bombs-second-how-we-imagine-climate-change.html

- Polar jet stream appears hugely deformed
http://arctic-news.blogspot.com/2012/12/polar-jet-stream-appears-hugely-deformed.html

- Near-Term Human Extinction
http://arctic-news.blogspot.com/2014/04/near-term-human-extinction.html


Sunday, October 26, 2014

Ocean Temperature Rise

Ocean Temperatures

Of all excess heat resulting from people's emissions, 93.4% goes into oceans. Accordingly, the temperature of oceans has risen substantially.

Globally, the average September ocean temperature marked a record high for that month in 2014, at 0.66°C (1.19°F) above the 20th century average, breaking the previous record that was set just one month earlier. On the Northern Hemisphere, the temperature of the ocean in September 2014 was 0.83 °C (or 1.49 °F) above the 20th century, 


The anomaly was 0.84 °C in August 2014, as illustrated by the image below.

On specific days, anomalies were much higher. On August 19, 2014, the Northern Hemisphere showed a sea surface temperature anomaly of 1.78 °C, while the North Atlantic sea surface temperature was 1.82 °C above average (CFSR 1979-2000 Baseline) on October 16, 2014, as illustrated by the image below.


Sea surface temperature anomalies are at the top end of the scale in many places in the Arctic, as well as off the coast of North America. The danger is that the Gulf Stream will keep carrying ever warmer water from the North Atlantic into the Arctic Ocean, threatening to unleash huge methane eruptions from the Arctic Ocean's seafloor, in turn causing even higher temperatures and more extreme weather events, wildfires, etc.


Above image shows methane levels as high as 2666 ppb, as measured by the MetOp-2 Satellite at 14,385 ft (~4.4 km) altitude on October 26, 2014 am.

Is 2666 ppb as high as it will get?

Sadly, methane releases from the seafloor of the Arctic Ocean are becoming increasingly larger around this time of year and they look set to get even larger than this. Note that the amount of methane actually erupting from the seafloor of the Arctic Ocean is even larger than what is visible on above image, for the following three reasons.

  1. No data were available for some areas, as the IASI (Infrared Atmospheric Sounding Interferometer) instrument measuring methane only covers a certain width. The white shapes showing up on above images are areas where no measurements were taken, resulting from the way the polar-orbiting satellite circum-navigates the globe, as pictured on the image on the right.

    Furthermore, quality control failed in the grey areas on above images, indicating reading difficulties due to high moisture levels (i.e. snow, rain or water vapor), as also discussed in an earlier post. Accordingly, high methane levels (above 1950 ppb) as show up in the yellow areas could also be present in the many grey areas over the Arctic Ocean.

    When also looking at methane levels on days following the high 2666 ppb reading, methane is persistently present over most of the Arctic Ocean, as illustrated by the above October 29, 2014, combination image, confirming that high methane levels were likely present in areas where no data were available on October 6, 2014.
       
  2. Much of the methane that is released from the Arctic Ocean's seafloor is broken down by microbes as it rises up in the water. The SWERUS-3 research team recently found methane in the waters of the East Siberian Sea at levels that equate to atmospheric levels of  3188 ppb.
       
  3. Much methane is broken down in the atmosphere by hydroxyl, as illustrated by the image below, showing carbon dioxde levels on October 27, 2014, that indicate that large amounts of methane are broken down at higher latitudes on the Northern Hemisphere.

The latter point could explain the sudden recent rise in carbon dioxide levels, as also detected at Mauna Loa, Hawaii, as illustrated by the image below.


In conclusion, the amount of methane that is erupting from the seafloor of the Arctic Ocean is larger than what is visible on satellite images, and the water will be highly saturated with methane at locations where the methane is escaping from the seafloor, highlighting the danger that, in case of large abrupt releases from the Arctic Ocean's seafloor, microbes and hydroxyl will quickly get depleted locally, resulting in little of the methane being broken down, as discussed at an earlier post.

Why are such huge amounts of methane starting to get released from the Arctic Ocean's seafloor now?  

As the image below shows, temperature at 2 meters was below 0°C (32°F, i.e. the temperature at which water freezes) over most of the Arctic Ocean on October 26, 2014. The Arctic was over 6°F (3.34°C) warmer than average, and at places was up to 20°C (36°F) warmer than average.


Above image illustrates the enormous amount of heat that has until now been transferred from the waters of the Arctic Ocean to the atmosphere. Underneath the surface, water temperatures are much higher than they used to be and, as around this time of year the Arctic Ocean freezes over, less heat will from now on be able to escape to the atmosphere. Sealed off from the atmosphere by sea ice, greater mixing of heat in the water will occur down to the seafloor of the Arctic Ocean.

As land around the Arctic Ocean freezes over, less fresh water will flow from rivers into the Arctic Ocean. As a result, the salt content of the Arctic Ocean increases, making it easier for ice in cracks and passages in sediments at the seafloor of the Arctic Ocean to melt, allowing methane contained in the sediment to escape. Furthermore, the sea ice makes that less moisture evaporates from the water, which together with the change of seasons results in lower hydroxyl levels at the higher latitudes of the Northern Hemisphere, in turn resulting in less methane being broken down in the atmosphere over the Arctic.

This situation will continue for months to come. Salty and warm water (i.e. warmer than water that is present in the Arctic Ocean) will continue to be carried by the Gulf Stream into the Arctic Ocean, while less heat and moisture will be able to be transferred to the atmosphere.

In conclusion, high methane levels threaten to further accelerate warming in the Arctic, in a vicious cycle escalating into runaway warming and resulting in death, destruction and extinction at massive scale.

So, what can be done to reduce the risk?

Climate Plan

- Emission Cuts

It is imperative that large emissions cuts are made quickly. The Climate Plan calls for 80% emission cuts by 2020, as one of multiple lines of action that need to be implemented in parallel.

- Greenhouse Gas Removal and Storage

The IPCC points at the need for carbon dioxide removal and also warns about ocean warming continuing for centuries (text below).


Indeed, even if all emissions by people could somehow be brought to an abrupt end, this alone will not stop the rise of ocean temperatures, at least not for a long time. For starters, air temperatures would start rising within days, in response to the disappearance of aerosols that now mask the full wrath of global warming. Furthermore, such a temperature rise would further accelerate feedbacks such as snow and ice decline, methane hydrate destabilization, etc., in turn feeding further temperature rises.

The Climate Plan therefore calls for carbon dioxide removal, as well as for active removal of other greenhouse gases from the atmosphere, and for further lines of action.

- Further Action

Again, merely implementing the above lines of action will not suffice to quickly bring down ocean temperatures. Paleo-climate records show that falls in temperature go hand in hand with falls of carbon dioxide in the atmosphere to levels under 280 ppm, as opposed to current carbon dioxide levels that are around 400 ppm.


Raising Funding for Further Action

The Climate Plan calls for comprehensive and effective action that includes additional lines of action. Such additional action will require U.N. supervision, which may make it hard for the necessary action to obtain sufficient funding.

In earlier posts, it was suggested that, besides having fees imposed on facilities that burn fossil fuel and on sales of fossil fuel itself, additional fees could be imposed on commercial international flights. As long as it seems too hard to substantially reduce emissions associated with such flights, it seems appropriate to explore further ways to minimize such flights, e.g. by imposing additional fees that could help fund further action.

There are a number of ways such fees could be implemented. Such fees could be calculated based on the distance traveled or as a percentage of the fare.

Fees could also be calculated on the basis of the traveler's flying history, e.g. in the form of frequent flyer fees. Such fees could be collected either by the respective airline or airport.

In the box on the right, Ekta Kalra gives further details about how the latter idea could be implemented.

What do you think?


References and related posts

- Four Hiroshima bombs a second: how we imagine climate change
http://arctic-news.blogspot.com/2013/08/four-hiroshima-bombs-second-how-we-imagine-climate-change.html

- Arctic Methane Release and Rapid Temperature Rise are interlinked
http://arctic-news.blogspot.com/2013/11/arctic-methane-release-and-rapid-temperature-rise-are-interlinked.html

- Climate Change Accelerating
http://arctic-news.blogspot.com/2014/10/climate-change-accelerating.html

- NOAA, Global Analysis - September 2014
http://www.ncdc.noaa.gov/sotc/global/2014/9

- NOAA Ocean temperature anomalies
http://www.ncdc.noaa.gov/cag/time-series

- Methane Hydrates
http://methane-hydrates.blogspot.com/2013/04/methane-hydrates.html

- Climate Plan
http://climateplan.blogspot.com


Saturday, October 11, 2014

Climate Change Accelerating

Methane levels as high as 2562 ppb were recorded on October 9, 2014, as illustrated by the image below.

Many grey areas show up in the image where QC (quality control) failed, as it was too hard to read methane levels in the respective area, apparently due to high moisture levels (i.e. snow, rain or water vapor) in the atmosphere.


As above image illustrates, cloud cover is high over the Arctic, while there is also precipatation in the form of snowfall.

In other words, high levels of methane (above 1950 ppb, colored yellow) could be present over a much larger part of the Arctic Ocean, while methane in these grey areas could be even higher than the measured peak level of 2456 ppb.

This appears to be confirmed by persistent high methane levels over vast areas across the Arctic Ocean both in the morning (top part of the image further above) and in the afternoon (bottom part of image) on 9 October 2014.

Methane levels are this high over the Arctic Ocean for the number of reasons, including:
  • The Gulf Stream keeps pushing warm water into the Arctic Ocean.
  • The resulting eruptions of methane from the seafloor of the Arctic Ocean constitute a feedback that accelerates warming in the Arctic. 
  • As the Arctic warms up more rapidly than the rest of Earth, the Arctic's ice and snow cover will decline, further accelerating warming in the Arctic.
  • As the Arctic warms up more rapidly than the rest of Earth, the speed at which jet streams circumnavigates the Northern Hemisphere will weaken, making it meander more, resulting in a greater frequency and intensity of extreme weather events, such as heat waves, droughts and wildfires. 
Here's an example of intense warming. Look at what is currently happening on Greenland.

As the image above right shows, sea surface temperature anomalies as high as +1.89°C hit the North Atlantic (on October 8, 2014). 

Furthermore, high cloud cover over the Arctic (image further above) makes it hard for the heat there to radiate out into space, further contributing to high temperature anomalies.

The image on the right shows high temperature anomalies over Greenland and parts of the Arctic Ocean on October 11, 2014. Note that anomalies are averaged out over the course of the day (and night).

The image below (right) shows anomalies at the top end of the scale hitting large parts of Greenland at a specific time during this day. The left part of the image below shows how this could happen, i.e. jet streams curling around Greenland trapping warm air inflow from the North Atlantic.


As said, as the Arctic warms up more rapidly than the rest of Earth, the speed at which jet streams circumnavigate the Northern Hemisphere will weaken, making the jets meander more and creating patterns that can trap heat (or cold) for a number of days over a given area. Due to the height of its mountains, Greenland is particularly prone to be increasingly hit by heatwaves resulting from such blocking patterns. Warming changes the texture of snow and ice, making it more slushy and darker, which also makes that it absorbs more of the sunlight's heat, further accelerating melting.

As Paul Beckwith warns in an earlier post, melt rates on Greenland have doubled in the last 4 to 5 years, and melt rates on the Antarctica Peninsula have increased even faster. Based on the last several decades, melt rates have had a doubling period of around 7 years or so. If this trend continues, we can expect a sea level rise approaching 7 meters by 2070.

From: More than 2.5 m sea level rise by 2040
These are all indications that the pace of climate change is accelerating in many ways, the most dangerous one being ever larger methane eruptions from the Arctic Ocean's seafloor. As the image below shows, sea surface temperature anomalies are very high in the Arctic Ocean, indicating very high temperatures under the surface.


U.S. Secretary of State John Kerry recently said: “There are now – right now – serious food shortages taking place in places like Central America because regions are battling the worst droughts in decades, not 100-year events in terms of floods, in terms of fires, in terms of droughts – 500-year events, something unheard of in our measurement of weather.” Warning about looming catastrophe, Kerry adds: “Life as you know it on Earth ends. Seven degrees increase Fahrenheit (3.9°C), and we can't sustain crops, water, life under those circumstances.”

The situation is dire and calls for comprehensive and effective action, as discussed at the Climate Plan blog.


Monday, October 6, 2014

Wild Weather Swings


Above combination-image illustrates some of the wild temperature swings that are taking place on the Northern Hemisphere. While the average temperature anomaly on the Northern Hemisphere may not differ much between the two dates (+0.95°C versus +1.07°C), huge temperature swings can occur locally, as is the case in Greenland.

Note that the overall temperature anomaly for the Arctic is +2.16°C and +3.34°C, respectively, but it can be much more locally. What contributes to these high temperatures in the Arctic is that heat from the Arctic Ocean is entering the atmosphere where there still is open water, while large emissions of methane from the seafloor of the Arctic Ocean are exercizing their high immediate local warming potential.

On the Southern Hemisphere, things aren't much different, as illustrated by the combination-image below.


The two images show that, while the average anomaly for the Southern Hemisphere and for the Antarctic may not differ much between the two dates, temperature anomalies locally may go from one end of the scale to the other.

And it's not merely temperatures that seem to have gone wild. Winds have strengthened, which can push sea ice far out into the sea surrounding Antarctica, while the resulting open water quickly freezes over. The result is expanding sea ice that traps heat in the ocean, as discussed in an earlier post. It appears that much of the extra energy trapped by greenhouse gasses becomes manifest as kinetic energy, in the form of stronger winds, storms and ocean currents.

In conclusion, these huge temperature swings combine with pressure swings and storms, and with swings between expansion and contraction of soil and ice, resulting in severe shocks to ecosystems and infrastructure.

The threat is that infrastructure will increasingly come under stress. Infrastructure that was built up over hundreds, if not thousands of years, is not easily replaced with more durable alternatives. Parts of infrastructure such as roads, buildings, railways, storm water and drainage systems, water supply, dams, levees and power poles may collapse without much scope for repair.

Furthermore, soil degradation will increase, as in some areas storms grow stronger and run-off causes more erosion, while other areas may be hit by more severe droughts and dust-storms. In both cases, ecosystems will suffer and can go into shock, bringing food supply and habitat progressively and possibly abruptly under threat.

As more and deeper cracks and fractures appear in sediments and soils, more methane may start entering the atmosphere. Indications that the integrity of the permafrost is breaking up under the stress of such swings were discussed in earlier posts such as this one and this one. The extra methane can constitute a powerful additional feedback loop, causing strong additional warming locally.

The situation is dire and calls for comprehensive and effective action, as discussed at the Climate Plan blog.


References and Related Posts


- Climate Plan
http://arctic-news.blogspot.com/2014/07/climate-plan.html

- Antarctica linked to Arctic
http://arctic-news.blogspot.com/2014/09/antarctica-linked-to-arctic.html

- What's wrong with the weather?
http://arctic-news.blogspot.com/2014/07/whats-wrong-with-the-weather.html

- Is Global Warming breaking up the Integrity of the Permafrost?
http://methane-hydrates.blogspot.com/2013/05/is-global-warming-breaking-up-the-integrity-of-the-permafrost.html

- Earthquakes in the Arctic Ocean
http://arctic-news.blogspot.com/2014/04/earthquakes-in-the-arctic-ocean.html

- Ten Dangers of Global Warming (written March, 2007)
http://samcarana.blogspot.com/2007/03/ten-dangers-of-global-warming.html


Saturday, October 4, 2014

Record June–August Global Ocean Surface Temperature

August 2014 record high land and ocean temperature

The combined average temperature across global land and ocean surfaces for August 2014 was record high for the month, at 0.75°C (1.35°F) above the 20th century average of 15.6°C (60.1°F).

June–August 2014 record high land and ocean temperature

June–August 2014, at 0.71°C (1.28°F) higher than the 20th century average, was the warmest such period across global land and ocean surfaces since record keeping began in 1880.

August 2014 record high sea surface temperature

The August global sea surface temperature (SST) was 0.65°C (1.17°F) above the 20th century average of 16.4°C (61.4°F). This record high departure from average not only beats the previous August record set in 2005 by 0.08°C (0.14°F), but also beats the previous all-time record set just two months ago in June 2014 by 0.03°C (0.05°F).

June–August 2014 record high sea surface temperature

The June–August global ocean surface temperature was 0.63°C (1.13°F) above the 20th century average, the highest on record for June–August. This beats the previous record set in 2009 by 0.04°C (0.07°F).


John Davies comments: 

This was the warmest August on record, primarily due to very high Sea Surface Temperatures in the Northern Hemisphere.

There is no El Nino event in this period, but some sort of event - hopefully an event not a climate shift - is taking place. If this is an event, the situation will become more normal when it ends, which will be in less than a years time at worst. If it is a climate shift, we are in desperate trouble, though I think it is an event.

It is worth noting that these very high Sea Surface Temperatures are likely to lead to high land temperatures soon, as normally land temperatures in the Northern hemisphere can be expected to exceed Sea Surface Temperatures.

The drought affecting California and the whole of the west of North America, Central America, and large parts of the Brazilian rainforest, though preceding this event was almost certainly down to changes which started before this event but ultimately caused it.


Despite the record high combined average temperature across global land and ocean surfaces for August, the global economy will continue as normal and no specific action can be expected to be taken to curb emissions. This will change, if global temperatures continue to rise. Temperatures are high enough to cause global concern, however. More later.


Note: NOAA's most recent (Sep 4, 2014) prediction puts the chance of El Niño at 60-65% during the Northern Hemisphere fall and winter.


Sea surface temperatures (SST) can be expected to remain high in the Arctic Ocean, as SST anomalies are high in the North Atlantic (+1.65°C, image left) and high temperatures are forecast over the Arctic for at least the next seven days (anomalies as high as +2.87°C, image right). For a comparison with October 3 temperatures, see this earlier post.

Additionally, an increasing amount of heat has been going into the deeper parts of the ocean, and the Gulf Stream will for month to come continue to transport water into the Arctic Ocean, and this water will be warmer than the water already there, threatening to unleash ever larger eruptions of methane from the seafloor of the Arctic Ocean, as discussed in this earlier post.

In conclusion, the situation is dire and calls for comprehensive and effective action, as discussed at the Climate Plan blog.


References

- NOAA National Climatic Data Center, State of the Climate: Global Analysis for August 2014.
http://www.ncdc.noaa.gov/sotc/global/2014/8

- EL NIÑO/SOUTHERN OSCILLATION (ENSO) DIAGNOSTIC DISCUSSION, issued by:
Climate Prediction Center/NCEP/NWS and the International Research Institute for Climate and Society, 4 September 2014
http://www.cpc.ncep.noaa.gov/products/analysis_monitoring/enso_advisory/ensodisc.pdf

- ENSO: Recent Evolution, Current Status and Predictions
http://www.cpc.ncep.noaa.gov/products/analysis_monitoring/lanina/enso_evolution-status-fcsts-web.pdf

- ClimateReanalyzer.org
http://climatereanalyzer.org


Friday, October 3, 2014

Where we are - A climate system summary

by Paul Beckwith


Air


The presence of GHGs (greenhouse gases) in the atmosphere is vital to sustain life on our planet. These GHGs trap heat and keep the global average surface temperature of the planet at about 15°C, versus a chilly -18°C, which would be our temperature without the GHGs.

We have changed the chemistry of the atmosphere, specifically of the concentrations of the GHGs. Concentrations of carbon dioxide have increased about 40% since the start of the industrial revolution (from a tight range between 180 to 280 ppm over at least the last million years) to 400 ppm. Concentrations of methane have increased by more than 2.5x since the start of the industrial revolution (from a tight range of 350 to 700 ppb) to over 1800 ppb. The additional heat trapped has warmed our planet by over 0.8°C over the last century, with most of that rise (0.6°C) occurring in the last 3 or 4 decades.

Oceans

Over 90% of the heat trapped on the surface of the planet is increasing the temperature of the ocean water. The increased levels of carbon dioxide in the atmosphere acidify the rainfall, and have increased the acidity of the oceans by about 40% in the last 3 to 4 decades (pH of the open ocean has dropped from 8.2 down to 8.05 on the logarithmic scale). An increased drop to a pH of 7.8 will prevent calcium based shells from forming, and threaten the entire food chain of the ocean. Changes in ocean currents, and vertical temperature profiles are leading to more stratification and less overturning which is required to transport nutrients to the surface for phytoplankton to thrive.

Global sea levels are presently rising at a rate of 3.4 mm per year, compared to a rate of about 2 mm per year a few decades ago. Melt rates on Greenland have doubled in the last 4 to 5 years, and melt rates on the Antarctica Peninsula have increased even faster. Based on the last several decades, melt rates have had a doubling period of around 7 years or so. If this trend continues, we can expect a sea level rise approaching 7 meters by 2070.

From: More than 2.5 m sea level rise by 2040
Land

Higher global average temperatures have increased the amount of water vapor in the atmosphere by about 4% over the last several decades, and around 6% since the start of the industrial revolution. Changes in heat distribution with latitude from uneven heating with latitude has slowed the jet streams and caused them to become wavier and fractured, and has changed the statistics of weather. We now have higher frequencies, intensities, and longer duration extreme weather events and also a change in location of where these events occur.

Feedback loops

The sensitivity of the climate system to increased levels of GHG appears to be much higher than previously expected due to many powerful reinforcing feedbacks.

From: Arctic Warming due to Snow and Ice Demise

Arctic temperature amplification from exponentially declining sea ice and spring snow cover are the strongest feedbacks in our climate system today. The average albedo (reflectivity) of the Arctic region has decreased from 52% to a present day value of 48% over 3 or 4 decades. The increased absorption of energy in the Arctic has increased the temperature at high latitudes at rates up to 6 to 8x the global average temperature change. The reduced temperature difference between the Arctic and equator has reduced the west to east speed of the jet streams causing them to slow and become wavier and more fractured, and directly causing a large change in the statistics of our global weather.

Methane gas emissions have been rapidly rising in the Arctic region from the terrestrial permafrost and the continental shelf marine sediments, most notably on the ESAS (Eastern Siberia Arctic Shelf). The extremely potent ability of methane to warm the planet (global warming potential GWP is >150, 86, and 34 times for methane relative to carbon dioxide on a few year, several decade, and century timescale, respectively) makes increased emissions an extremely dangerous risk to our well-being on the planet.

My overall assessment

Our climate system is presently undergoing preliminary stages of abrupt climate change. If allowed to continue, the planet climate system is quite capable of undergoing an average global temperature increase of 5°C to 6°C over a decade or two. Precedence for changes at such a large rate can be found at numerous times in the paleo-records. From my chair, I conclude that it is vital that we slash greenhouse gas emissions and undergo a crash program of climate engineering to cool the Arctic region and keep the methane in place in the permafrost and ocean sediments.


Paul Beckwith
Paul Beckwith is part-time professor with the laboratory for paleoclimatology and climatology, department of geography, University of Ottawa. Paul teaches climatology/meteorology and does PhD research on 'Abrupt climate change in the past and present'. Paul holds an M.Sc. in laser physics and a B.Eng. in engineering physics and reached the rank of chess master in a previous life. Click here to view Paul's earlier posts at the Arctic-news blog.


Related

- What's wrong with the weather?
http://arctic-news.blogspot.com/2014/07/whats-wrong-with-the-weather.html

- Arctic News: Polar jet stream appears hugely deformed
http://arctic-news.blogspot.com/2012/12/polar-jet-stream-appears-hugely-deformed.html