Showing posts with label sea ice. Show all posts

Friday, December 26, 2014

Year 2014 Pictures Dire Situation

The year 2014 is shaping up to be the warmest year on record and the heat is felt most strongly in the polar regions and in the oceans. 

Surface Temperatures


Above images show that the Arctic is experiencing accelerating warming. This is causing jet stream changes, resulting in more extreme weather events. Besides creating havoc around the globe, such extreme weather events can further speed up warming of the Arctic Ocean and subsequent release of methane from its seafloor, as described in more detail in a recent post

Ocean Heat

The primary driver of methane release from the Arctic Ocean seafloor is ocean heat. NOAA analysis shows that the global ocean surface temperature for the year-to-date (January through to November 2014) was 1.03°F (0.57°C) above average, the warmest such period on record. The anomaly is even more pronounced in the Norther Hemisphere, as illustrated by the image below.


Ocean temperatures can show much higher anomalies locally, as illustrated by the image below. The high sea surface temperatures near Svalbard give an indication of how warm the ocean current is below the surface.

2014 SST anomaly near Svalbard (green circle) Aug 26: 7.3°C, Sep 26: 6.7°C, Oct 26: 5.9°C, Nov 26: 4.2°C, Dec 26: 3.7°C
The danger is that ocean temperatures will continue to rise, especially in the North Atlantic, and that the Gulf Stream will keep carrying ever warmer water from the North Atlantic into the Arctic Ocean, where it will destabilize methane hydrates contained in sediments under the seafloor.

Methane

Methane levels are already exceptionally high over the Arctic, as illustrated by the recent NOAA image below. Since end October 2014, huge quantities of methane have erupted from the seafloor of the Arctic Ocean. As said, the primary driver of methane release from the Arctic Ocean seafloor is ocean heat. Water temperatures off the coast of North America get very high in July and it takes a few months for ocean currents to carry this heat to the Arctic Ocean. Further reasons why methane levels over the Arctic suddenly get very high from the end of October are discussed in this post.

The Gulf Stream will keep carrying water into the Arctic Ocean that is warmer than the water already there. These methane eruptions will therefore continue into the new year, threatening to further accelerate warming in the Arctic and cause even more extreme weather events, wildfires and further emissions in the year 2015, in a spiral of runaway warming. 


The combination image below shows the strength at which methane is erupting from the Arctic Ocean seafloor. On December 25, 2014, methane lights up the northern sky like a Christmas tree. The image shows levels at 6 km (19,820 ft) altitude, as recorded by, from top to bottom, MetOp-1 am (up to 2277 ppb), MetOp-1 pm (up to 2295 ppb) and MetOp-2 am (up to 2336 ppb).


MetOp-2 records for December 25, 2014, pm, are incorporated in the animation below, showing methane concentrations reaching levels of up to 2284 ppb at an altitude of 6 km (19,820 ft) and reaching even higher levels of up to 2329 ppb at an altitude of 9.3 km (30,570 ft).


The troposphere is deepest at tropical latitudes, where it reaches altitudes of up to 20 km (12 mi), and rather shallow at the polar regions, where it only reaches altitudes of some 7 km (4.3 mi) in winter. For high concentrations of methane to show up over the Arctic Ocean at such a high altitude is a further indication of the strength of these methane eruptions.

Furthermore, the methane that shows up in the atmosphere is only a fraction of the methane that is erupting from the seafloor, as part of the methane will be broken down by microbes as it rises up through the water and gets stuck under the sea ice.

Arctic Sea Ice 


Sea ice only 1m thin at North Pole.
Click on image to enlarge.
The above Naval Research Laboratory animation shows that, while sea ice is now covering the entire Arctic ocean, it is in many places only about one meter thin or less. The December 20, 2014, image on the right shows 1m thin sea ice at the North Pole.

Meanwhile, huge chuncks of thick sea ice are moving along the edges of Greenland and Ellesmere Island into the Atlantic ocean.

An exponential trendline based on sea ice volume observations shows that sea ice looks set to disappear in 2019, while disappearance in 2015 is within the margins of a 5% confidence interval, reflecting natural variability.

In other words, extreme weather events could cause Arctic sea ice to collapse as early as 2015, with the resulting albedo changes further contributing to the acceleration of warming in the Arctic and causing further methane eruptions from the seafloor of the Arctic Ocean.

Demise of the sea ice and snow cover in the Arctic results in further acceleration of warming, not only due to less sunlight getting reflected back into space, but also due to loss of the buffer that currently absorbs huge amounts of heat as it melts in summer. With the demise of this latent heat buffer, more sunlight will instead go into heating up the water of the Arctic Ocean. For more on the latter, see the page on latent heat

Feedbacks


Above image illustrates some of the self-reinforcing feedback loops that have been highlighted in this post. Further feedbacks are pictured in the image below.

from the Feedbacks page


Situation Calls For Comprehensive And Effective Action

The situation is dire and calls for comprehensive and effective action, as discussed at the Climate Plan blog.


Sunday, November 23, 2014

IPCC too conservative?


Earlier this month, the Intergovernmental Panel on Climate Change (IPCC) released its 5th Assessment Report (AR5), stating that: "Surface temperature is projected to rise over the 21st century under all assessed emission scenarios. It is very likely that heat waves will occur more often and last longer, and that extreme precipitation events will become more intense and frequent in many regions. The ocean will continue to warm and acidify, and global mean sea level to rise. Many aspects of climate change and associated impacts will continue for centuries, even if anthropogenic emissions of greenhouse gases are stopped. The risks of abrupt or irreversible changes increase as the magnitude of the warming increases."

That does sound scary. So, what would happen if the IPCC's projections are too conservative? Could humans, together with many other species, go extinct within the next few decades? What are the risks that this could eventuate? Below follows an assessment using graphics by Sam Carana.


1. Ocean Heat

Below is what the IPCC says:


Below is a graph produced by Sam Carana, based on NOAA data. For more background, see this earlier post.


2. Sea level Rise

The image below shows what the IPCC says.


If ocean heat will continues to rise as pictured in the image by Sam Carana, then thermal expansion alone will cause more sea level rise than foreseen by the IPCC. Furthermore, extensive melting on Antarctica and Greenland can result in additional sea level rise. Below is a sea level rise graph produced by Sam Carana, based on NASA/GSFCs data, as discussed in this earlier post.


3. Arctic Sea Ice

The image below shows what the IPCC says.


If ocean heat will continues to rise as pictured in the image by Sam Carana, then Arctic sea ice will disappear much earlier than anticipated by the IPCC. An exponential trendline based on sea ice volume observations shows that sea ice looks set to disappear in 2019, while disappearance in 2015 is within the margins of a 5% confidence interval, reflecting natural variability.


A linear trend would be inappropriate, given the growing impact of feedbacks that can each be expected to reinforce sea ice decline, while there can also be interaction between these feedbacks, further accelerating sea ice decline. Albedo change is one such feedback, but there are numerous other ones, such as storms that have more chance to grow stronger as the area with open water increases.

In conclusion, an exponential trendline is more appropriate than a linear trendline, as also illustrated by above comparison, which shows that a linear trendline has 9 years fall outside its 95% confidence ionterval, versus 4 years for an exponential trendline. as discussed at the FAQ page.

Rapid decline of the snow and ice cover on the Northern Hemisphere is furthermore supported by rapidly rising surface temperatures over the Arctic, as well as greater intensity of heatwaves. Below is what the IPCC says on this.


Before further discussing surface temperatures, let's look into one of the feedbacks that could hugely increase temperatures, methane.


4. Methane

The IPCC appears to underestimate of the amount of methane that is contained in sediments under the Arctic Ocean and prone to be released as temperatures rise, as discussed in this earlier post and in this earlier post.

The image below, based on data from the IPCC and the World Metereological Organization (WMO), with an added observation from a NOAA MetOp satellite image, illustrates the recent rise of methane levels and the threat that methane levels will continue to rise rapidly.


When looked at from a longer range of years, above image fits in the black square on the image below.


As ocean heat keeps increasing and warming in the Arctic keeps accelerating due to feedbacks such as Arctic sea ice decline, huge methane eruptions from the seafloor of the Arctic Ocean threaten to push up methane levels even further. The image below shows exponential rise based on data of East Siberian Arctic Shelf (ESAS) releases alone, as discussed in an earlier post.


Non-linear rise is supported by the fact that methane's lifetime increases as more methane enters the atmosphere.


5. Surface Temperatures

The IPCC expects that, worst case, global average temperature could rise by 13 degrees Celsius by 2300, as illustrated by the image below.


The situation could be much worse than foreseen by the IPCC, due to the non-linear way feedbacks can hugely increase temperature rises.


The threat is that such rapid temperature rises will appear at first in hotspots over the Arctic and eventually around the globe, while also resulting in huge temperature swings that could result in depletion of supply of food and fresh water, as further illustrated by the above image, from an earlier post, and the image below, from another earlier post.


The situation is dire and calls for comprehensive and effective action, as discussed at the Climate Plan blog.


Friday, October 3, 2014

Where we are - A climate system summary

by Paul Beckwith


Air


The presence of GHGs (greenhouse gases) in the atmosphere is vital to sustain life on our planet. These GHGs trap heat and keep the global average surface temperature of the planet at about 15°C, versus a chilly -18°C, which would be our temperature without the GHGs.

We have changed the chemistry of the atmosphere, specifically of the concentrations of the GHGs. Concentrations of carbon dioxide have increased about 40% since the start of the industrial revolution (from a tight range between 180 to 280 ppm over at least the last million years) to 400 ppm. Concentrations of methane have increased by more than 2.5x since the start of the industrial revolution (from a tight range of 350 to 700 ppb) to over 1800 ppb. The additional heat trapped has warmed our planet by over 0.8°C over the last century, with most of that rise (0.6°C) occurring in the last 3 or 4 decades.

Oceans

Over 90% of the heat trapped on the surface of the planet is increasing the temperature of the ocean water. The increased levels of carbon dioxide in the atmosphere acidify the rainfall, and have increased the acidity of the oceans by about 40% in the last 3 to 4 decades (pH of the open ocean has dropped from 8.2 down to 8.05 on the logarithmic scale). An increased drop to a pH of 7.8 will prevent calcium based shells from forming, and threaten the entire food chain of the ocean. Changes in ocean currents, and vertical temperature profiles are leading to more stratification and less overturning which is required to transport nutrients to the surface for phytoplankton to thrive.

Global sea levels are presently rising at a rate of 3.4 mm per year, compared to a rate of about 2 mm per year a few decades ago. Melt rates on Greenland have doubled in the last 4 to 5 years, and melt rates on the Antarctica Peninsula have increased even faster. Based on the last several decades, melt rates have had a doubling period of around 7 years or so. If this trend continues, we can expect a sea level rise approaching 7 meters by 2070.

From: More than 2.5 m sea level rise by 2040
Land

Higher global average temperatures have increased the amount of water vapor in the atmosphere by about 4% over the last several decades, and around 6% since the start of the industrial revolution. Changes in heat distribution with latitude from uneven heating with latitude has slowed the jet streams and caused them to become wavier and fractured, and has changed the statistics of weather. We now have higher frequencies, intensities, and longer duration extreme weather events and also a change in location of where these events occur.

Feedback loops

The sensitivity of the climate system to increased levels of GHG appears to be much higher than previously expected due to many powerful reinforcing feedbacks.

From: Arctic Warming due to Snow and Ice Demise

Arctic temperature amplification from exponentially declining sea ice and spring snow cover are the strongest feedbacks in our climate system today. The average albedo (reflectivity) of the Arctic region has decreased from 52% to a present day value of 48% over 3 or 4 decades. The increased absorption of energy in the Arctic has increased the temperature at high latitudes at rates up to 6 to 8x the global average temperature change. The reduced temperature difference between the Arctic and equator has reduced the west to east speed of the jet streams causing them to slow and become wavier and more fractured, and directly causing a large change in the statistics of our global weather.

Methane gas emissions have been rapidly rising in the Arctic region from the terrestrial permafrost and the continental shelf marine sediments, most notably on the ESAS (Eastern Siberia Arctic Shelf). The extremely potent ability of methane to warm the planet (global warming potential GWP is >150, 86, and 34 times for methane relative to carbon dioxide on a few year, several decade, and century timescale, respectively) makes increased emissions an extremely dangerous risk to our well-being on the planet.

My overall assessment

Our climate system is presently undergoing preliminary stages of abrupt climate change. If allowed to continue, the planet climate system is quite capable of undergoing an average global temperature increase of 5°C to 6°C over a decade or two. Precedence for changes at such a large rate can be found at numerous times in the paleo-records. From my chair, I conclude that it is vital that we slash greenhouse gas emissions and undergo a crash program of climate engineering to cool the Arctic region and keep the methane in place in the permafrost and ocean sediments.


Paul Beckwith
Paul Beckwith is part-time professor with the laboratory for paleoclimatology and climatology, department of geography, University of Ottawa. Paul teaches climatology/meteorology and does PhD research on 'Abrupt climate change in the past and present'. Paul holds an M.Sc. in laser physics and a B.Eng. in engineering physics and reached the rank of chess master in a previous life. Click here to view Paul's earlier posts at the Arctic-news blog.


Related

- What's wrong with the weather?
http://arctic-news.blogspot.com/2014/07/whats-wrong-with-the-weather.html

- Arctic News: Polar jet stream appears hugely deformed
http://arctic-news.blogspot.com/2012/12/polar-jet-stream-appears-hugely-deformed.html


Saturday, September 6, 2014

Antarctica linked to Arctic

Waters in the Arctic Ocean continue to warm up. Very warm waters from the North Atlantic and Pacific Ocean are invading the Arctic Ocean.


Waters in the North Atlantic and in the North Pacific are very warm, due to a number of reasons.

What is happening in the oceans is very important in this respect. As discussed in earlier posts, most of the extra heat caused by people's emissions goes into the oceans.

The great ocean conveyor belt (Thermohaline Circulation), brings warm water from the southern hemisphere to the northern hemisphere.

The Gulf Stream is the North Atlantic leg of the great ocean conveyor belt, and it brings dense, salty water from the North Atlantic into the Arctic Ocean.

Saltier water is denser than fresher water because the dissolved salts fill interstices between water molecules, resulting in more mass per unit volume.

Very dense ocean water can be found in the North Atlantic because the North Atlantic has high salinity, due to high evaporation rates, while salty water is also coming from the Mediterranean Sea.

As also discussed in an earlier post, this dense, saltier water sinks in the North Atlantic, accumulating in deeper water.

By contrast, much of the Arctic Ocean has low salinity, due to ice melt and river runoff.  As it enters the Arctic Ocean, the warm and dense water from the Atlantic thus dives under the under the sea ice and under the less salty surface water in the Arctic Ocean.

In conclusion, much of the heat resulting from people's emissions accumulates in the North Atlantic and also ends up in the Arctic. This partly explains why surface temperatures are rising much faster at the poles, as illustrated by the NOAA image below.


There are further reasons why surface air temperatures elsewhere (other than at the poles) are rising less rapidly than they did, say, a decade ago. As also discussed by Andrew Glikson in the post No Planet B, the increased amounts of sulphur emitted by the growing number of coal-fired power plants and by the burning of bunker fuel on sea is (temporarily) masking the full wrath of global warming.

Another reason is the growth of the sea ice around Antarctica, as illustrated by the CryosphereToday image on the left.

Melting takes place both in the Arctic and on Antarctica, but more so in the Arctic. Recent research of CryoSat-2 data reveals that Greenland alone is now losing about 375 cubic kilometers of ice annually, while in Antarctica the annual volume loss now is about 125 cubic kilometers.

Currents also distribute ocean heat in ways that make the Arctic warm up more than twice as rapidly as the Antarctic. In a recent paper, John Marshall et al. further suggest that ozone depletion also contributes to this.

All this makes that, while the jet streams on the northern hemisphere are circumnavigating the globe at a slower pace, jet streams on the southern hemisphere are getting stronger, making it more difficult for warm air to enter the atmosphere over Antarctica, while the stronger winds also speed up sea currents on the southern hemisphere. This makes the sea ice around Antarctica grow, and as the sea ice spreads further away from Antarctica, temperatures of surface waters around Antarctica are falling.

Growth of the sea ice around Antarctica makes that more sunlight is reflected back into space. There now is some 1.5 million square kilometers more sea ice around Antarctica than there used to be. The albedo change associated with sea ice growth on the southern hemisphere can be estimated at 1.7 W/sq m, i.e. more than the total RF of all CO2 emission caused by people from 1750 to 2011 (IPCC AR5).


The rapid growth of sea ice on the southern hemisphere alone goes a long way to explain why, over the past three months, surface air temperatures have not been much higher than they used to be, both globally and in the Arctic, as illustrated by above NOAA image. What has also contributed to warmer temperatures around latitude 60 on the northern hemisphere is the fact that methane has accumulated in the atmosphere at that latitude, as discussed in earlier posts.

Arctic SST far exceed anything ever seen in human history
So, does the sea ice on the southern hemisphere constitute a negative feedback that could hold back global warming? It doesn't.

It may temporarily keep surface temperatures close to what they used to be, as the sea ice reflects lots of sunlight back into space, but at the same time ocean temperatures are rising strongly, as the sea ice also prevents heat from radiating out of the waters around Antarctica.

The latter also helps explaining the colder surface temperatures over those waters.

Much of this additional ocean heat has meanwhile been transported by the great ocean conveyor belt to the northern hemisphere.

No time before in human history has such a huge amount of ocean heat accumulated in the North Atlantic and the North Pacific. This heat is now threatening to invade the Arctic Ocean and trigger huge temperature rises due to methane eruptions from the seafloor.


The situation is dire and calls for comprehensive and effective action, as dicussed at the Climate Plan blog.

Friday, July 4, 2014

The Threat of Storms Wreaking Havoc in the Arctic Ocean

Arctic sea ice extent is close to a record low for the time of the year, as the image below shows.


Furthermore, the current decline in sea ice extent is much steeper than it used to be for this time of the year, raising the specter of sea ice hitting an absolute record low later this year. Moreover, a total collapse of sea ice may occur if storms continue to develop that push the remaining ice out of the Arctic Ocean into the Atlantic Ocean.


The threat posed by storms is illustrated by the track projected to be followed by Hurricane Arthur (above NOAA image, July 4), renamed as Post-Tropical Cyclone Arthur (NOAA image below, July 5).


The path followed by Arthur is influenced by the current shape of the jet stream. As the animation below illustrates, the jet stream looks set to prevent Hurrican Arthur from moving to the east and instead make it move into the Labrador Sea to the west of Greenland and - partly due to the high mountains on Greenland - continue to wreak havoc in Baffin Bay further north.

[ Note: this animation is a 1.87 MB file that may take some time to fully load ]
As described in an earlier post, post-tropical cyclone Leslie made landfall with hurricane-force winds in Newfoundland in September 2012. The large extratropical low pressure system continued to move rapidly northeastward across eastern Newfoundland at a forward speed of near 45 kt, and merged with a much larger extratropical low over the Labrador Sea.

Recent research by NOAA-affiliated scientists suggests that - over the years - the latitude where hurricanes, typhoons, and cyclones reach their maximum intensity on the Northern Hemisphere has shifted closer to the North Pole.

Such storms can bring lots of heat and moisture into the Arctic, and they can also increase the height of waves. All this can have devastating impact on the sea ice. The many ways in which storms can increase the dangerous situation in the Arctic is described in the post Feedbacks in the Arctic.

Last month, the June heat record broke in Greenland. Very high temperatures are currently recorded all over North America, as the image below shows.


Furthermore, sea surface temperature anomalies in the Arctic are currently very high, as the image below shows.


Additionally, the sea ice is currently very thin, as shown by the Naval Research Laboratory animation below.


The above animation further shows that there now is very little sea ice left in Baffin Bay, making it easier for storms to cause very high waves that could enter the Arctic Ocean and break the sea ice north of Greenland and Canada.

Arctic sea ice volume minimum is typically reached around halfway into September. This is still months away, but the prospect of an El Niño event striking this year now is 90%, according to predictions by the European Centre for Medium-range Weather Forecasts.

All this combines into a growing threat that hydrates contained in sediments will destabilize and that huge quantities of methane will be released abruptly from the seafloor of the Arctic Ocean. The risk that this will eventuate is intolerable and calls for parallel lines of action as pictured in the image below.

Climate Plan, July 7, 2014 version, as discussed at this Climate Plan post and at the Climate Plan blog

Related

- Storm enters Arctic region
arctic-news.blogspot.com/2012/09/storm-enters-arctic-region.html

- Huge cyclone batters Arctic sea ice
arctic-news.blogspot.com/2012/08/huge-cyclone-batters-arctic-sea-ice.html

- Hurricane Sandy moving inland
http://arctic-news.blogspot.com/2012/10/hurricane-sandy-moving-inland.html

- Feedbacks in the Arctic
http://arctic-news.blogspot.com/2014/03/feedbacks-in-the-artcic.html


Monday, June 9, 2014

Arctic Sea Ice Steep Decline Continues


Steep decline of the Arctic sea ice continues. The yellow line on the image below follows 2014 sea ice area up to June 5 and shows that sea ice area now is close to a record low for the time of the year.

[ click on image to enlarge ]
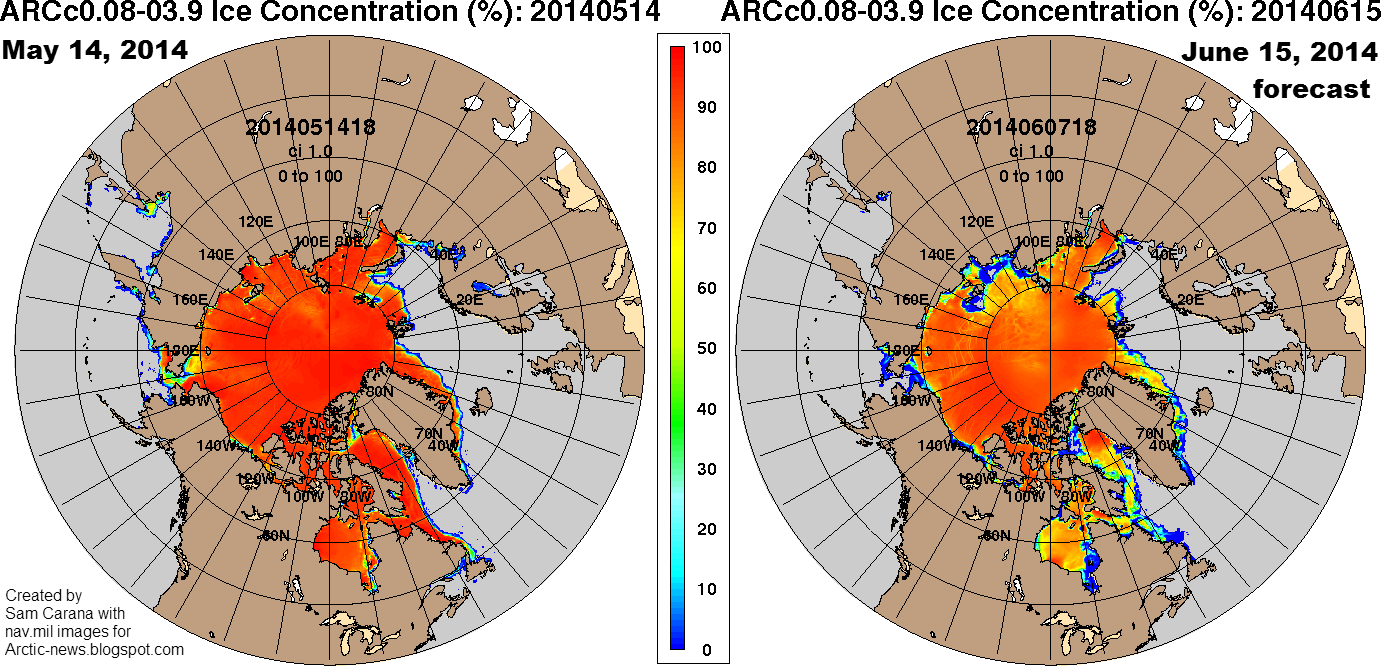
The Naval Research Laboratory image below compares sea ice concentration on May 14, 2014 (left) with the sea ice concentration forecast for June 15, 2014 (run on June 7, 2014, on the right).


Above image shows falling sea ice concentration, with low sea ice concentration extending to the center of the Arctic Ocean.

Low sea ice concentration at the center of the Arctic Ocean is an ominous sign; at last year's minimum, very little sea ice was left close to the North Pole, as discussed in an earlier post.

On the right is an image of the University of Bremen showing sea ice concentration on June 8, 2014 (click on the images to enlarge them).

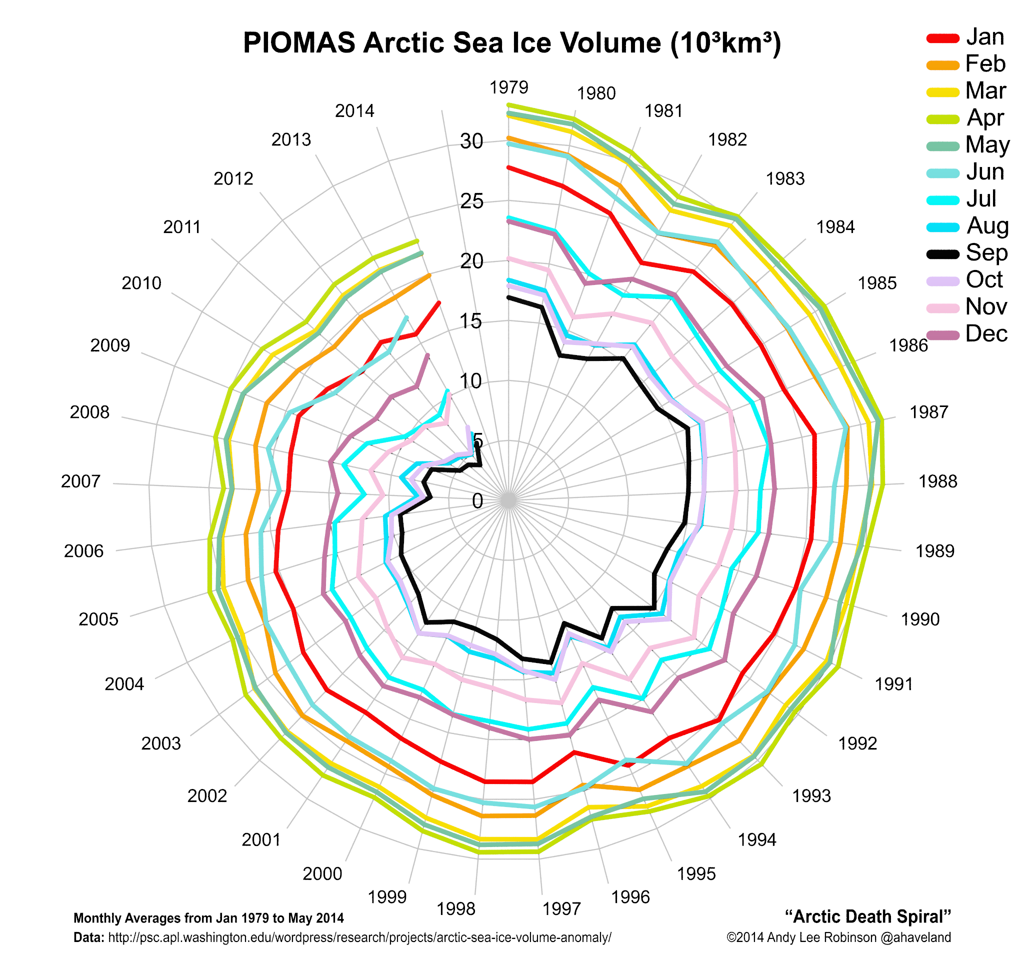
Arctic sea ice already is very thin, as discussed in recent posts. The image below shows that the sea ice volume trend down to zero was confirmed for the months April and May 2014.

[ image by Andy Lee Robinson based on PIOMAS data, click on image to enlarge ]
The lowest sea ice volume for 2014 is expected to be reached in September, and - given the shape the ice is in now - will likely be one of the lowest minima on record. In fact, there is a chance that there will be no ice left whatsoever later this year. As illustrated by the image by Wipneus below, an exponential curve based on annual minima from 1979 points at zero ice volume end 2016, with the lower limit of the 95% confidence interval pointing at zero ice end of 2014.
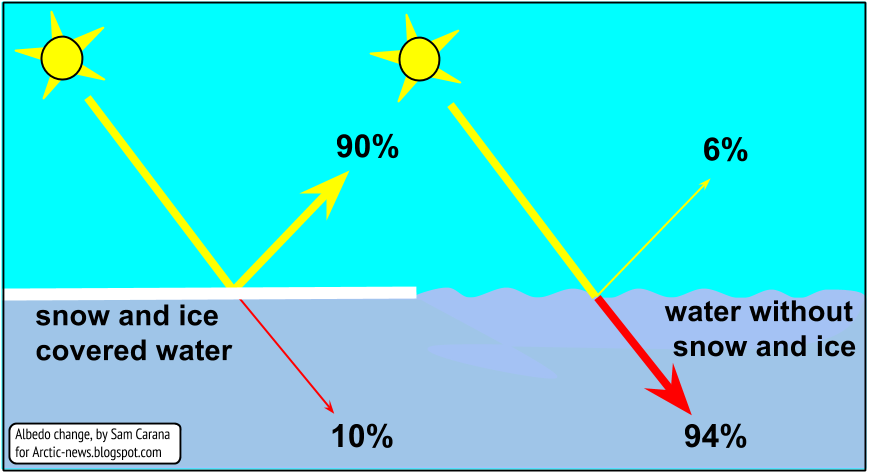
As the sea ice disappears, a lot more heat will be absorbed by the Arctic Ocean. Sea ice reflects 50% to 70% of the incoming energy, describes NSIDC.org, but thick sea ice covered with snow reflects as much as 90% of the incoming solar radiation. Melting of snow creates melt ponds on the ice and because shallow melt ponds have an albedo of approximately 0.2 to 0.4, the surface albedo drops to about 0.75. As melt ponds grow and deepen, the surface albedo can drop to 0.15. The ocean reflects only 6% of the incoming solar radiation and absorbs the rest. Snow and ice decline comes with a further feedback in that all the energy that during the melt went into transforming ice into water will - in the absence of ice - now be absorbed by the ocean as well.

Accelerated Warming in the Arctic

[ from the post Near-Term Human Extinction ]
Such feedbacks are causing warming to accelerate in the Arctic Ocean, as depicted in above image and described in the earlier post Feedbacks in the Arctic. Much of the Arctic Ocean is very shallow and the seafloor is thus vulnerable to warming. The Gulf Stream can be expected to keep carrying warmer water into the Arctic Ocean, so the situation is dire, while extreme weather events such as heatwaves and cyclones can make the situation even worse.

The NOAA image below shows huge sea surface temperature anomalies all over the Northern Hemisphere on June 8, 2014.

[ click on image to enlarge ]
Large areas with sea surface temperature anomalies up to 8°C and higher show up in and around the Arctic Ocean, as further illustrated by the image below.

[ click on image to enlarge ]
The image below shows high sea surface temperature anomalies from February 21, 2014, up to June 9, 2014, on the Northern Hemisphere (red bars), next to global average anomalies (orange/shaded bars).


The global sea surface temperature anomaly is worrying (a 1.25°C anomaly was reached on May 22, 2014). See the NOAA website to compare this with earlier months. Note that on specific spots the anomaly is much higher, as illustrated by the images further above.

Warm surface waters in the Arctic sea ice spell bad news, given that the sea ice is already at or close to record lows, in terms of area and volume.

And as ocean heat threatens to melt the sea ice from beneath, the sun is now strongly warming up the ice from above. Insolation in the Arctic is at its highest at this time of year, as Earth reaches its maximum axial tilt toward the sun of 23° 26'. In fact, insolation during the months June and July is higher in the Arctic than anywhere else on Earth, as discussed at this earlier post.

The diminishing temperature difference between the equator and the North Pole reduces the speed at which the Jet Stream circumnavigates Earth and it makes the Jet Stream become wavier, increasing opportunities for cold air to escape from the Arctic and for warm air to move in. More extreme weather increases the chance of intense and prolonged heatwaves and fierce cyclones, storms and winds to hit the Arctic Ocean.

Making things even worsen, there is the prospect of an El Niño event, projected to occur later this year. According to NOAA (June 5, 2014), the chance of El Niño is 70% during the Northern Hemisphere summer and reaches 80% during the fall and winter. El Niño odds are even higher than this, according to this post at the Wunderground blog.


Methane

Temperature rises of the water close to the seafloor of the Arctic Ocean are very dangerous, as heat can penetrate sediments and cause hydrate destabilization. Huge amounts of methane are held in sediments at the seafloor, in the form of free gas and hydrates. In shallow waters, methane released from the seafloor can more easily enter the atmosphere without getting broken down by microbes in the water.

Methane levels are already very high. On June 6, 2014, mean global methane reached levels as high as 1809 ppb, with peaks as high as 2516 ppb.

Methane release from the seafloor of the Arctic Ocean will warm up the Arctic even further, triggering even more methane releases, heatwaves, wildfires and further feedbacks, in a spiral of runaway warming, threatening to cause starvation, destruction and extintion at massive scale across the globe.


Earthquakes

Earthquakes are a further worry. A huge amount of melting takes place in Greenland, as described in the post Ten Cubic Kilometers of Ice Lost From Jakobshavn Glacier in Less than One Month. As the ice disappears, a large weight is lefted from Greenland, causing the Earth's crust there to be lifted in a phenomenon referred to as isostatic rebound. This can cause earthquakes to occur on the seafloor of the waters around Greenland, as illustrated by the image below.

[ click on image to enlarge ]

As the image below shows, the faultline alongside Greenland crosses the Arctic Ocean and extends into the Laptev Sea and Siberia, an area recently hit by two large earthquakes.

[ click on image to enlarge ]
Earthquakes in this region are very worrying. Earthquakes can trigger further earthquakes, especially at locations closeby on the same faultline. Earthquakes and subsequent shockwaves and landslides can further contribute to destabilization of methane hydrates contained in sediments under the seafloor of the Arctic Ocean.

In conclusion, the situation is dire and calls for comprehensive and effective action, as discussed at the climate plan blog.


Related

- M4.4 Earthquake hits Arctic Ocean north of Greenland
http://arctic-news.blogspot.com/2014/04/m45-earthquake-hits-arctic-ocean.html

- M4.5 Earthquake hits Arctic Ocean
http://arctic-news.blogspot.com/2014/04/m45-earthquake-hits-arctic-ocean.html

- Earthquakes in the Arctic Ocean
http://arctic-news.blogspot.com/2014/04/earthquakes-in-the-arctic-ocean.html

- Methane, Faults and Sea Ice
http://arctic-news.blogspot.com/2013/11/methane-faults-and-sea-ice.html

- Norwegian Sea hit by 4.6M Earthquake
http://arctic-news.blogspot.com/2013/11/norwegian-sea-hit-by-46m-earthquake.html

- Greenland Sea hit by M5.3 Earthquake
http://arctic-news.blogspot.com/2013/10/greenland-sea-hit-by-m53-earthquake.html

- Earthquake hits waters off Japan
http://arctic-news.blogspot.com/2013/10/earthquake-hits-waters-off-japan.html

- Earthquake hits Laptev Sea
http://arctic-news.blogspot.com/2013/09/earthquake-hits-laptev-sea.html

- Methane Release caused by Earthquakes
http://arctic-news.blogspot.com/2013/09/methane-release-caused-by-earthquakes.html

- Earthquake M6.7 hits Sea of Okhotsk
http://methane-hydrates.blogspot.com/2013/10/earthquake-m67-hits-sea-of-okhotsk.html

- Sea of Okhotsk
http://methane-hydrates.blogspot.com/2013/06/sea-of-okhotsk.html

- Seismic activity
http://arctic-news.blogspot.com/p/seismic-activity.html

- Climate Plan
http://climateplan.blogspot.com