Monday, October 29, 2012

Climate Change Sandy Says to US: 'Take That, Idiots!'

By Nathan Currier


Superstorm Sandy shows signature of human-induced climate change 

Nathan Currier, senior climate advisor for Public Policy Virginia

After the second presidential debate, moderator Candy Crowley said, "Climate change -- I had that question, all you climate change people. We just -- you know, again, we knew that the economy was still the main thing, so you knew you kind of wanted to go with the economy." And the media's been talking about low information voters?

Now, along comes Sandy, who says to Candy, "Okay, then, take that!" See, Sandy doesn't get into debating these things, either. Now, let's see what Sandy's bill ends up being -- anyone taking bets? -- then let's sit down and talk some economy. In fact, there's an idea: Maybe a new American pastime could be organized 'disaster gambling,' with states collecting revenue as everyone bets on the tab for each new upcoming climate change disaster in their respective states?

Perhaps some still take issue with the suggestion that a superstorm like this is caused by our human-engendered climate change. But cigarette packages say things like, "cigarettes cause fatal lung disease." This, of course, is just shorthand, a monumental simplification, because in fact causation in complex systems is always a vastly complicated affair, and tobacco companies spent lots of money blowing smoke in the face of all that complexity: but the likelihood of getting lung disease is so greatly increased by smoking that eventually they gave up and we all agreed to go 'low-info' by just saying cigarettes cause fatal lung disease. As I'll demonstrate, in much the same way, we might as well keep it simple and just say this superstorm is caused by our human-made climate change.

I've been writing on the arctic crisis, and in a recent long list of immediate physical changes from loss of summer arctic sea ice, I listed (as #12) its potential impacts on weather at lower latitudes. It so happens that it is just at this time of year that this has the clearest line of causation, since lots of heat and moisture enter the atmosphere from the open waters that had been ice covered, and latent heat is released in the refreezing process, which progresses rapidly as the arctic cools down right around now. As Jennifer Francis of Rutgers University described in a recent paper: "This warming is clearly observable during autumn in near-surface air temperature anomalies in proximity to the areas of ice loss."

And this in turn becomes very important for large-scale atmospheric circulation. For example, Dr. Francis has used the metaphor of a river going down a steep incline, which runs straight, versus a river that runs along a flat plain, which tends to meander. Likewise the jet stream, since the normal energy gradient between arctic air and that of lower latitudes has become more relaxed in tandem with ice extent drops, is tending to meander more, and hence move more slowly as well. As the Francis paper said, "Previous studies support this idea: weaker zonal-mean, upper-level wind* is associated with increased atmospheric blocking events in the northern hemisphere." [*she means high west-east moving winds]

Let's look back again at this superstorm, and you'll see that important features of what you're about to experience stem from the arctic situation I've been discussing. First, arctic air is coming down to hook up with Sandy from the dip of the jet stream. Francis writes (from personal communication),
"The huge ice loss this summer, and subsequent enhanced warming of the Arctic (see attached figure), may be playing an important role in the evolution of Sandy by enhancing the amplitude of waves in the jet stream."

At the same time, high pressure over Greenland, and the extremely negative state of the North Atlantic Oscillation, is creating a blocking event that is impacting the path of Sandy herself, sending her back west over the U.S. Again, Dr. Francis (in personal communication):
"In this case, the effects could be causing strengthening of the block, elongating the block northward, and/or increasing its duration -- and this block is what's driving Sandy on such an unusual track westward into the mid-Atlantic coast."

Now, let's add to all that the underlying and obvious thing -- that Sandy is only surviving as a hurricane so far north, almost in November, because there are record high sea surface temperatures off the U.S. East coast right now. And while the third storm component, the one coming in from the west, might seem less remarkable, that is also something that generally becomes more probable with global warming, as our atmosphere can hold more water vapor as it warms and the evaporation rate is also increased by the warming. Thus, all major components of this superstorm show the signature of human-induced climate change to varying degrees, and without global warming the chance of the three occurring together like this would have a probability of about zero. So, let's make it simple, and just say climate change caused this storm.

I'm in New York City, just as much in the path of Sandy as so many others are, but come on, you do just have to sit back and love it, appreciate the full irony of it all, with Sandy striking right at those most sensitive loins of our American democracy, threatening to interrupt our sacred electoral process, after that process blocked climate change out, and now an atmospheric blocking pattern, created by that very climate change, pushes Sandy back on us. In a time when climate silence trumps climate science, when the candidates seem terrified to mention the 'C-word,' Candy, I hope you enjoy meeting Sandy. Maybe if the election gets as messed up as 2000, you three can even find time to meet up again, and go over a little issue you couldn't quite find time to fit in before? In my next piece I'll get back back to discussing what we should do right away, and hopefully it will at least be a bit clearer that this is serious business.

[First posted at the Huffington Post; posted with author's permission]

Warming Gulf Stream causes methane release

The Gulf Stream (dashed lines on NOAA image below) pushes warm water north.


Phrampus & Hornbach (2012) have analyzed the stability of methane hydrates along the Carolina rise off the east coast of North America using active-source seismic reflection data, with the goal of characterizing hydrate stability below the Gulf Stream.

The study suggests that ocean warming above the Carolina rise, caused by a warming Gulf Stream, is rapidly destabilizing methane hydrate along a broad swathe of the North American margin.

The area of active hydrate destabilization covers at least 10,000 square kilometres of the United States eastern margin, and occurs in a region prone to kilometre-scale slope failures.

The image on the right shows the study area; the pink area is where methane hydrate is destabilizing owing to recent changes in ocean temperature; the approximate location of the Gulf stream is between the two solid black arrows.

Over the past 5,000 years or so, the western North Atlantic margin has been warming by up to eight degrees Celsius. This is now triggering the destabilization of an estimated 2.5 gigatonnes of methane hydrate. The analysis suggests that we are observing the onset of methane hydrate destabilization along an ~300-km span of the North American margin that will continue for centuries unless the Gulf Stream shifts southward or intermediate ocean temperatures cool several degrees.

If continuing hydrate destabilization triggers slope failure at this site, the amount of methane released could be an order of magnitude greater. Furthermore, recent studies have suggested that similar ocean temperature shifts are taking place elsewhere, notably in the Arctic Ocean; the estimate of 2.5 gigatonnes of destabilizing methane hydrate is therefore likely to represent only a fraction of the methane hydrate currently destabilizing globally.


Without action, global warming looks set to increase temperature anomalies in the oceans. The above image shows the sea surface temperature anomalies that are now present along the east coast of North America.

In many ways, the situation in the Arctic is even more dire than in the Carolina rise. A warming Gulf Stream will push warmer water into the Arctic, which has many areas with extremely shallow seas, giving methane little opportunity to be oxidized in the sea. Furthermore, colder water in the Arctic is less friendly toward microbes that can decompose methane in the water. Once methane does reach the atmosphere, there's little hydroxyl in the Arctic atmosphere to decompose the methane there.

Most importantly, the Arctic contains huge amounts of methane and the Arctic is experiencing huge temperature anomalies in summer, due to albedo changes and further feedbacks. Therefore, the Arctic looks set to experience huge abrupt releases of methane that will add to make the situation in the Arctic worse, in a vicious spiral threatening to escalate into runaway global warming.

References

- Recent changes to the Gulf Stream causing widespread gas hydrate destabilization, Phrampus & Hornbach, Nature 490, 527–530 (25 October 2012) doi:10.1038/nature11528
http://www.nature.com/nature/journal/v490/n7421/full/nature11528.html

Related

- Big changes in Arctic within years
arctic-news.blogspot.com/2012/10/big-changes-in-arctic-within-years.html

- Diagram of Doom
arctic-news.blogspot.com/2012/08/diagram-of-doom.html

- How extreme will it get?
arctic-news.blogspot.com/2012/07/how-extreme-will-it-get.html

- The potential impact of large abrupt release of methane in the Arctic
arcticmethane.blogspot.com/2012/05/potential-impact-of-large-abrupt.html

- Methane in the Arctic
arctic-news.blogspot.com/2012/05/video-and-poster-methane-in-arctic.html

Friday, October 26, 2012

Hurricane Sandy moving inland

Hurricane Sandy is moving inland and its impact is forecast to be felt as far away as in Toronto and Ottawa.

Coastal Watches/Warnings and 5-Day Track Forecast Cone
Hurricane SANDY Advisory #019       11:00 PM EDT Fri October 26, 2012
from:  National Hurricane Center (check link for updates!)


Paul Beckwith,
B.Eng, M.Sc. (Physics),
Ph.D. student (Climatology)
and Part-time Professor,
University of Ottawa
 
This prompted Paul Beckwith to make the following comments:

All storms veer to the right in the northern hemisphere due to the spinning of the earth (1 revolution per day). Except when there is a tilted high pressure region northward and it has to go left and there is a massive low pressure region left that sucks it there as well. 

Why the high pressure ridge and massive low pressure? Because the jet stream is wavier and slower, a situation that is happening more and more often, because of massive sea ice decline this summer. Which is due to Arctic amplification feedbacks. Which in turn is due to rising greenhouse gases. Which is due to humans.

The situation is further illustrated by the image below, from ClimateCentral.

An atmospheric "blocking pattern" will push Sandy north, then northwestward, into the Mid-Atlantic or Northeast. Click to enlarge the image.     Credit: Remik Ziemlinski, Climate Central.
In an earlier post, Paul Beckwith described that a very rare cyclone churned up the entire Arctic region for over a week in early August 2012, destroying 20% of the ice area by breaking it into tiny chunks, melting it, or spitting it into the Atlantic. Cold fresh surface water from melted sea ice mixed with warm salty water from a 500 metre depth! Totally unexpected. A few more cyclones with similar intensity could have eliminated the entire remaining ice cover. Thankfully that didn't happen. What did happen was Hurricane Leslie tracked northward and passed over Iceland as a large storm. It barely missed the Arctic this time. Had the storm tracked 500 to 600 kilometres westward, Leslie would have churned up the west coast of Greenland and penetrated directly into the Arctic Ocean basin.

We dodged a bullet, at least this year. This luck will surely run out. What can we do about this? How about getting our politicians to listen to climatologists, for starters.

Below, rainfall forecast from the Hydrometereological Prediction Center of the National Weather Service - check the link for updates! 


Related

- Vanishing Arctic sea ice is rapidly changing global climatearctic-news.blogspot.com/2012/09/vanishing-arctic-sea-ice-is-rapidly-changing-global-climate.html

- Storm enters Arctic region

- Huge cyclone batters Arctic sea ice
arctic-news.blogspot.com/2012/08/huge-cyclone-batters-arctic-sea-ice.html

Open Letter to Canadian MPs

Paul Beckwith
Food is the new oil. Land is the new gold.

The world food situation is deteriorating. Grain stocks have dropped to a dangerously low level. The World Food Price Index has doubled in a decade. The ranks of the hungry are expanding. Political unrest is spreading.

On the demand side of the food equation, there will be 219,000 people at the dinner table tonight who were not there last night. And some 3 billion increasingly affluent people are moving up the food chain, consuming grain-intensive livestock and poultry products.

At the same time, water shortages and heat waves are making it more difficult for farmers to keep pace with demand. As grain-exporting countries ban exports to keep their food prices down, importing countries are panicking. In response, they are buying large tracts of land in other countries to grow food for themselves. The land rush is on.

Could food become the weak link for us as it was for so many earlier civilizations? This slideshow presentation, based on Lester Brown's latest book, Full Planet, Empty Plates: The New Geopolitics of Food Scarcity, explains why world food supplies are tightening and tells what we need to do about it.
http://www.earth-policy.org/books/fpep/fpep_presentation

My video clip filmed about 3 weeks ago on Parliament Hill explains the clear connections between crop failures/droughts/floods/extreme weather/sea ice/greenhouse gases/climate change...
http://www.youtube.com/watch?feature=player_embedded&v=zw1GEp8UBj4

This is my presentation on Parliament Hill (Center blog) a few months ago at the All-Party Climate Change Caucus meeting.
https://docs.google.com/file/d/0ByLujhsHsxP7NG42RjVQLXBrV1k/edit

This is a longer version of the linkages between food shortages and declining sea ice.
https://docs.google.com/file/d/0ByLujhsHsxP7NThkM05iN1BXZ2s/edit


Please let me know what your plan is to deal with this coming turmoil.
I look forward to your response.


Sincerely,

Paul Beckwith (B.Eng. Engineering Physics, M.Sc. Physics, presently working on Ph.D. in climatology)

Big changes in Arctic within years

Above interactive graphic illustrates the decline of the annual sea ice minimum volume in the Arctic over the years.

What trend can best be fitted to these data? Below, I've added a trendline that I believe best fits the data, but I encourage others to come up with better trends.


The trend points at 2014 as the year when Arctic sea ice will first reach zero volume for some time during that year. As discussed in the earlier post Getting the Picture, the Arctic Ocean looks set to be ice-free for a period of at least three months in 2015 (August, September and October), and for a period of at least 6 months from the year 2020 (June through to November).

Natural variability and strong feedbacks may speed things up further. Decline of sea ice in 2012 was such that we can expect a very low volume in December 2012, which could lead to inclusion of December in the period projected to be ice-free from 2020. That would make the ice-free period seven month long, i.e. well over half a year.

The image below shows the three areas where albedo change will be felt most in the Arctic, i.e. sea ice loss, decline of albedo in Greenland and more early and extensive retreat of snow and ice cover in other areas in the Arctic.


Related

- Getting the Picture
arctic-news.blogspot.com/2012/08/getting-the-picture.html

- Albedo change in the Arctic
arctic-news.blogspot.com/2012/07/albedo-change-in-arctic.html

- Greenland is melting at incredible rate
arctic-news.blogspot.com/2012/07/greenland-is-melting-at-incredible-rate.html

- Albedo change in the Arctic threatens to cause runaway global warming

Amplification of climate change in the Arctic

In contrast to multi-year old ice, first-year old ice—ice that formed only since the last melt season—is thinner, saltier, and much more prone to melt.


Over the years, the loss of sea ice has become especially manifest in the older ice, as illustrated by the image below.


Salt content and hardness play a part in multi-year ice’s resistance to melt, explains a recent NOAA article, but the main characteristic that allows the ice to survive the melt season is thickness.

Screenshots from: PIOMAS Arctic Sea Ice Thickness Simulation 1978-2011
The decline in thickness over the years goes a long way to explain the self-reinforcing character of sea ice decline in the Arctic.

As another recent NOAA article describes, there is “something extra” behind the record ice retreats of the past 6 years: each June, the prevailing winds shifted from their normal west-to-east direction and instead blew strongly from the south across the Bering and Chuchki Seas (left on the image below), over the North Pole, and out toward Fram Strait. (The length of the lines is qualitative: longer lines mean stronger winds.)

Average June wind vectors in 2007-2012 (orange) compared to 1981-2010 average (white) based on NCEP reanalysis data provided by Physical Sciences Division at NOAA ESRL. Map by Dan Pisut, NOAA Environmental Visualization Lab.

The image below shows the unusual air pressure patterns that gave rise to the wind shift. Air pressure across the Arctic in Junes from 2007-2012 was completely lopsided, with two pockets of higher-than-average pressure sprawled across the North American Arctic and Greenland. These areas of high pressure act like boulders in a river. They slow and disrupt the normal westerly flow of the wind, forcing it to make, large, meandering detours to the north or south.

Average geopotential height anomaly at 700 millibar pressure level in Junes from 2007-2012 compared to the long-term average (1981-2010) based on NCEP reanalysis data provided by PSD at NOAA ESRL. Orange colors are higher-than-average pressure; blue is lower-than-average pressure.     Map by Dan Pisut, NOAA Environmental Visualization Lab.
Arctic oceanographer and his NOAA colleagues think these “blocking highs” on the North American side of the Arctic created the unusually strong southerly flow that brought warm air into the central Arctic and over Greenland. The persistent southerly winds would help explain both the record low sea ice extent in summer 2012, as well as the island-wide melting of the surface of the Greenland Ice Sheet, which satellites detected in July 2012.

“This story started with us trying to figure out why the sea ice extents of the past 6 years or so have been so much lower than we would expect based on the long-term warming trend alone,” says Overland, “and we think this unusual circulation of the Arctic atmosphere is major part of it.”

Why, asks Overland, have these high pressure patterns have been forming so consistently each June for the past six years? The repeated appearance of these atmospheric features each June is so unusual that it’s the equivalent of a 1-in-a-1000 event. Can this be attributed to natural variability?

Instead, Overland’s hunch is that the cause is a change in the atmosphere that is itself connected to climate change in some way, possibly linked to record and near-record low June snow cover in the Canadian Arctic in recent years. “We don’t know that part of the story yet,” he says, “but this would certainly be the type of amplification of climate change [warming triggers changes that lead to more warming] we have been expecting to see in the Arctic.”

References

- Arctic Sea Ice Getting Thinner, Younger
http://www.climatewatch.noaa.gov/article/2012/arctic-sea-ice-getting-thinner-younger

- June wind shift a little something extra behind recent Arctic ice losses
http://www.climatewatch.noaa.gov/article/2012/june-wind-shift-a-little-something-extra-behind-recent-arctic-ice-losses

- Poles apart: A record-breaking summer and winter
http://nsidc.org/arcticseaicenews/2012/10/poles-apart-a-record-breaking-summer-and-winter/

- PIOMAS Arctic Sea Ice Thickness Simulation 1978-2011, published Sep 14, 2012 by ArctischePinguin
https://www.youtube.com/watch?v=G1TLzgSlGtQ

Related

- Arctic summer wind shift
http://arctic-news.blogspot.com/2012/10/arctic-summer-wind-shift.html

- The recent shift in early summer Arctic atmospheric circulation
http://www.agu.org/pubs/crossref/2012/2012GL053268.shtml

- Presentation by Dr. Jennifer Francis, Rutgers University
https://www.youtube.com/watch?v=RtRvcXUIyZg
http://marine.rutgers.edu/~francis/pres/Francis_Vavrus_2012GL051000_pub.pdf

Wednesday, October 24, 2012

Saving the Arctic Ice (#2)

By Nathan Currier

Greenpeace, Greenwashing and Geoengineering

Nathan Currier, senior climate advisor for Public Policy Virginia

I've been discussing the Greenpeace "Save the Arctic" campaign in light of the reality there, where we will likely reach near-zero summer arctic sea ice in just the next few years. Before exploring, in the next post, direct climate interventions that could really help save the arctic, we now must look at all our other options -- just as, in a medical crisis, one eliminates other options before opting for surgery.

Of course, one option is to blithely say, "Look, the ice can come back later," and therefore do nothing to impede the arrival of an ice-free arctic ocean. At the recent Greenpeace New York meeting, this seemed to be the tacitly assumed option. Now, I am quite aware of modeling studies demonstrating sea ice loss itself to be readily reversible. Andrew Revkin of the New York Times asked James Hansen at the meeting about the Eemian interglacial (~130,000-115,000 yrs ago), its ice loss and recovery -- seemingly keen to highlight this comforting reversibility. But this reversibility depends on environmental conditions. One minor detail that wasn't mentioned was that CO2 was then around pre-industrial levels (280ppm), hardly soaring up around 400ppm as now, a level possibly not seen on Earth for 15 million years, so one should hardly expect the planet to give an Eemian-style response now, either in the long-term or next year (for a variety of reasons aside from CO2 levels, in fact).

What about green energy, solar panels and the like, the kinds of things proposed at the Greenpeace meeting? Anyone contemplating emissions strategy ought to keep the UNEP graph (Shindell et al, 2011) in my first post up on their walls: Even pretty large CO2 source reductions won't bring relief from warming until about 2040 (and could bring near-term warming). By that time, the increased insolation to the arctic ocean might have gone so far as to give an ice-free arctic for a considerably larger chunk of the year, with really drastic effects. Is that a plan for "saving" the arctic?

The only way through emissions to have an impact on what is going on there right now is through non-CO2 reductions like black carbon and methane. And aside from that, there's nothing left except direct intervention -- which could cover a wide variety of options, some of them being what I'll call "localized geoengineering," and will discuss next time.

Now, Hansen has been the primary advocate of the concept of using non-CO2 reductions to help bridge the time gap of getting reduced warming from CO2 reductions, so my one question for Hansen at the meeting was whether he thought that could still be used alone to confront the arctic crisis. Hansen's answer was frank and accurate. As Hansen said, and I hope Greenpeace, Bill McKibben and all the others present heard, "If you need a rescue package, to some degree it inherently is geoengineering."

He didn't say that non-CO2 reductions wouldn't still be helpful (they are 100 percent necessary right away, just as massive CO2 reductions to near-zero by mid-century are necessary), but he certainly didn't say that they could halt the loss of the sea ice now alone, either -- indeed, I believe that the numbers show that they can't. It has now become clear that emissions reductions alone can no longer save the arctic ice. This is a big deal, and it needs to sink in.

Greenpeace's campaign aims to make the arctic a sanctuary, by which they primarily mean keeping out the fossil industry. Hansen himself has many papers stating that easily recoverable fossil sources inevitably will get used. The arctic's resources are obviously getting more easily recoverable by the season. Keeping the fossil industry away without cooling it is probably impossible -- and, at a certain level, might even be destructive. What if Greenpeace succeeded, but the arctic were left to melt? Picture some natural disaster, akin to the Macando well disaster, but happening all on its own. No, I don't mean an oil spill -- I mean a bunch of methane bubbling up from the seabed and reaching the atmosphere in large ongoing belches. This kind of thing is likely to start at some point if we let the sea ice disappear, as Hansen himself discussed at the meeting -- and it won't stop like an oil spill, but rather will likely become an ongoing process. Then we will actually need the fossil industry's expertise to go in there and help trap as much as possible. Believe me, I am not saying this to invite the fossil industry in. I am saying this because we must somehow keep the arctic cool. Lastly, ships and refineries both emit black carbon, which has an extremely strong but complex to quantify effect on local warming, and ice and snow-covered places are the most vulnerable to its effects because it settles on them and changes their reflectivity. So, even without fossil extraction, just if arctic ship traffic picks up dramatically, this could greatly accelerate ice (and snow) losses, helping ensure that this theoretical reversibility remains just that, something we'll never see. I'm sure Greenpeace means well, but currently their campaign most resembles those full-page greenwashing fantasies from Shell and PB, "Creating Your Clean Energy Future," and so on. At present, it's a sham.

The unquestioned reliance upon ice loss reversibility at the Greenpeace meeting might have been correct from a purely physical viewpoint alone, but was highly pernicious all the same, because it masks that we are about to quietly walk through the most monumental climate threshold we have yet crossed, and will then almost certainly discover, for a whole array of reasons -- all those minor physical mechanisms I elaborated last time, or the issues regarding the fossil industry I have just mentioned -- that it's difficult to turn around. Folks, what I am trying to say is: You can't let this happen, and yet you definitely can no longer prevent this happening just through emissions alone. That means that some form of direct climate intervention will be necessary there.

The clincher is this: When Hansen mentioned at the meeting that we could reverse ice loss, he also added, "And the truth is, we have to do that."

That is, he said, in order to avoid other major tipping points that clearly aren't reversible (ice sheets, methane hydrates). So the only remaining question is precisely when it must be reversed. London-based group AMEG, of which I am a member, takes the position: right away. Think of what this all means: It's completely impossible to achieve that reversal through emissions for many decades, even in the most optimistic scenario for large-scale emissions reductions -- and it would be far too dangerous to leave this unattended for that amount of time. So you will end up needing geoengineering in any case, just to achieve the reversal. Now, if you will quickly need to undo something that's about to happen, and potentially you might have great trouble undoing it at all later -- and the means will need to be the same in each instance -- then, isn't it far, far better to prevent that thing from happening, rather than trying to reverse it later?

Bill McKibben spoke with mild resignation about losing the sea ice, as though it were a pity, adding that we might "learn from it." But he's been profoundly ill-advised on the science, I'm afraid. If we don't fight this, we'll be "learning" like players of Russian roulette learn. And each decade left untreated might be like adding a bullet to the round.

Instead, we urgently need for Bill to understand this situation, and to start a "1250.org" (a 1250ppb target for methane) right away to complement his 350.org (Hansen's CO2 ppm target), and get his people back in the streets. Greenpeace must meet again with those scientists -- many more of them -- but with "time translators" present, so that Director Naidoo understands why Jim Hansen calls geoengineering a rescue package.

Trying to save the arctic is currently the most vital thing in the world, the front lines of the climate war, so let's all applaud Greenpeace for taking up the cause. Now they just have to bite the bullet, and recognize it's a fantasy unless two things happen right away, together at once:

1. A number of complementary direct arctic interventions (I'll discuss these soon).

2. Complete restructuring of the programs designed to reduce non-CO2 emissions (a long list of acronym-laden things like the M2M, GMF, GMI, CCAC), so that they really work -- and make this a public rallying cry, a global "1250" movement to help save ourselves.

[First posted at the Huffington Post; posted with author's permission]

Monday, October 22, 2012

State of Climate Change October 2012

A video featuring Paul Beckwith, climate scientist at University of Ottawa, who gives an update on the state of climate change, October 2012.


Paul adds that it was off the cuff and unscripted. "I wandered by Parliament Hill to see the people who were doing a climate change fast and ended up talking about the Arctic with them."

Here is a link to their website and protest:
http://www.facebook.com/CLIMATEFAST

Lethally Hot Temperatures During the Early Triassic Greenhouse

Paleogeographic reconstruction of the Early Triassic world (Smithian substage) around 250 million years ago, with
a ‘dead zone’ in the tropics. Presence of marine reptiles (ichthyosaurs), terrestrial tetrapods and fish was almost exclusively in higher latitudes (>30 °N and >40 °S) with rare exceptions. 
Credit: Yadong Sun, University of Leeds

The end-Permian mass extinction, which occurred around 250 million years ago, wiped out nearly all the world's species. Typically, a mass extinction is followed by a 'dead zone' during which new species are not seen for tens of thousands of years. In this case, the dead zone, during the Early Triassic period which followed, lasted for five million years.

A study jointly led by the University of Leeds and China University of Geosciences (Wuhan), in collaboration with the University of Erlangen-Nurnburg (Germany), shows the cause of this lengthy devastation was a temperature rise to lethal levels in the tropics: around 50-60°C (122-140°F) on land, and 40°C  (104°F) at the sea-surface.

Lead author Yadong Sun, who is based in Leeds while completing a joint PhD in geology, says: “Global warming has long been linked to the end-Permian mass extinction, but this study is the first to show extreme temperatures kept life from re-starting in Equatorial latitudes for millions of years.”

The dead zone would have been a strange world – very wet in the tropics but with almost nothing growing. No forests grew, only shrubs and ferns. No fish or marine reptiles were to be found in the tropics, only shellfish, and virtually no land animals existed because their high metabolic rate made it impossible to deal with the extreme temperatures. Only the polar regions provided a refuge from the baking heat.

Before the end-Permian mass extinction the Earth had teemed with plants and animals including primitive reptiles and amphibians, and a wide variety of sea creatures including coral and sea lillies.

This broken world scenario was caused by a breakdown in global carbon cycling. In normal circumstances, plants help regulate temperature by absorbing carbon dioxide and burying it as dead plant matter. Without plants, levels of carbon dioxide can rise unchecked, which causes temperatures to increase.

Professor Paul Wignall from the School of Earth and Environment at the University of Leeds, one of the study's co-authors, said: “Nobody has ever dared say that past climates attained these levels of heat. Hopefully future global warming won't get anywhere near temperatures of 250 million years ago, but if it does we have shown that it may take millions of years to recover.”

References

- Lethally Hot Temperatures During the Early Triassic Greenhouse
http://www.sciencemag.org/content/338/6105/366.abstract

Thursday, October 18, 2012

Is death by lead worse than death by climate? No.

Paul Beckwith,
B.Eng, M.Sc. (Physics),
Ph.D. student (Climatology)
and Part-time Professor,
University of Ottawa
 
by Paul Beckwith

Is death by lead worse than death by climate? That depends on your perspective. If you are the person dying then death by climate most likely means death by starvation. Or by dehydration. Or by painful vomiting and diarrhea from drinking contaminated water. It seems to me that this slow, painful death by climate would be much worse than catching a lead projectile from afar most likely with little or no warning.

If you are a journalist then penning death by lead stories allows you to write things that appeal to the visceral; namely to write about human conflict between “good” and “evil” and showing vivid images. People seem to innately enjoy reading about the competition of war or battle or insurgency and be able to cheer for a victor. To arms suppliers, it allows them to increase their profit margins. In addition, it allows politicians to have a rallying patriotic cry about the responsibility of their respective country to exercise some muscle with the pretense that they actually care about the well-being people being killed in another far off country. Or say that it is necessary to restore or create some democracy in such a country while ignoring the loss of democracy in their own country. Clearly hypocrisy. Almost inevitably armed intervention leads to a magnification of death and destruction.

How can western politicians, backed by an incredibly supportive and unquestioning main stream media and catering to the interests of large corporations make so much rah-rah about 20,000 people that have experienced death by lead in an internal conflict in one specific year in some other country while completely ignoring the deaths, every single year of 400,000 people?

That is the number of people, mostly children that are dying each year from climate change and carbon economies according to the DARA study that was released September 27th. Somehow this has been ignored up to now. However what politicians cannot ignore so easily is the claim in the same report that the global economy is losing 1.6% of GDP every year due to climate change. Today. Not in a decade or a century but today. This cannot be ignored so easily. In fact the Saturday Globe and Mail discussed the vanishing Arctic sea ice causing global extreme weather events causing global food supply disruption in a lengthy article on the front page of the Sept. 27th Business section. An image of the sea ice minimum of September 16th was even on the next page. Never before in the history of the Globe have I seen such a thing! Why was the article there? Not because of concern for sea ice or worry of extreme weather but because of the 1.6% GDP loss occurring today. Expected to rise to 3.5% of GDP loss 2030. Things are different now. Our world is changing rapidly, in real-time, before our very eyes. Just watch a video of the ice this summer. We have never experienced abrupt climate change before.

For decades, many climatologists have been warning that the energy balance of the earth is out of wack. Now, to the tune of the equivalent of 0.6 Watts per square meter over the entire surface of the planet. Isn’t this small, a Christmas tree bulb is a Watt or two? No. James Hansen calculated that this imbalance is equivalent to the energy of 300,000 Hiroshima sized bombs popping off every single second on every day of the year, year in and year out. Half of this energy is warming the atmosphere and half is warming the ocean. It is not small at all. Sounds like insanity to me. But I am biased. I live and breathe climatology and meteorology. Thus I know the dangers that climate change can bring much more deeply than others and I want to bring others up to speed. Quickly.

Methane hydrates: a volatile time bomb in the Arctic

By Carlos Duarte, University of Western Australia
and Antonio Delgado Huertas, Spanish Scientific Research Council CSIC

Methane locked under the Arctic ice could take climate change to a whole new level. Antonio Delgado Huertas
The risk with climate change is not with the direct effect of humans on the greenhouse capacity of Earth’s atmosphere. The major risk is that the relatively modest human perturbation will unleash much greater forces. The likelihood of this risk is intimately tied to the developments over the next decade in the Arctic.

Accelerating ice loss and warming of the Arctic is disturbing evidence that dangerous climate change is already with us. As I have argued earlier, now that we have realised this our efforts should be directed at managing the situation in the Arctic and avoiding the spread of dangerous climate change elsewhere.

The Arctic is a core component of the earth system. Six of the 14 climate change tipping points of the earth system are located in the Arctic region.

Whereas the term tipping point was initially introduced to the climate change debate in a metaphoric manner, it has since been formalised and introduced in the context of systems exhibiting rapid, climate-driven change, such as the Arctic. Tipping points have been defined in the context of earth system science as the critical point in forcing at which the future state of the system is qualitatively altered.

Tipping elements are defined, accordingly, as the structural components of the system directly responsible for triggering abrupt changes once a tipping point is passed. This is because they can be switched into a qualitatively different state by small perturbations.

Of the many tipping elements in the Arctic, that with potentially greatest consequences if perturbed is the vast methane deposit. Methane is a greenhouse gas. A molecule of methane has 20 times the greenhouse effect of a CO₂ molecule, and the release of methane has been linked to climatic transitions along the history of planet Earth.

The Arctic contains vast reserves of methane stored as methane hydrate, a gel-like substance formed by methane molecules trapped in frozen water. The methane hydrate deposits are estimated at between 1,000 and 10,000 Gigatons (109 tons) of CO₂-equivalents as methane, much of which is present in the shallow sediments of the extensive Arctic shelves. This amount of greenhouse gas is several times the total CO₂ release since the industrial revolution.

Even moderate (a few degrees C) warming of the overlying waters may change the state of methane from hydrates to methane gas, which would be released to the atmosphere. If this release is gradual, methane will add a greenhouse effect to the atmosphere. This will only be temporary, as it will be oxidised to CO₂, with a decline in the greenhouse effect of 20-fold per unit carbon.

However, if the state shift is abrupt it may lead to a massive release of methane to the atmosphere, which could cause a climatic jump several-fold greater than the accumulated effect of anthropogenic activity.
Data collected on a recent cruise confirm methane is being emitted. Antonio Delgado Huertas
Recent assessments have found bubbling of methane on the Siberian shelf. Models suggest that global warming of 3°C could release between 35 and 94 Gt C of methane, which could add up to an additional 0.5°C of global warming. Moreover, frozen soils and sediments contain large amounts of methane hydrates that can be released to the atmosphere. Indeed, rapid thawing of the Arctic permaforst has been reported to lead to the release of large amounts of methane.

In our most recent cruise this summer (June 2012) along the Fram Strait and Svalbard Islands we found concentrations of methane in the atmosphere of about 1.65 ppm. However our equilibrium experiments (air atmospheric with Arctic surface water) reached values that were generally between 2.5 ppm and 10 ppm, with maximum values up to 35 ppm. These results confirm that this area of the planet is emitting large amounts of methane into the atmosphere.

Understanding and forecasting the response of Arctic methane hydrate deposits to rapid warming and thawing in the Arctic is of the utmost importance.

Provided the magnitude of these risks, and those associated with other tipping elements in the Arctic, our collective response to climate change appears to be a careless walk on the razor edge.

Carlos Duarte receives funding from the Spanish Ministry of Economy and Competitiveness and the EU R&D 7th Framework Program to conduct research in the Arctic. He is affiliated, through a joint appointment, with the Spanish National Research Council (CSIC).

Antonio Delgado Huertas receives funding from Ministry of Economy and Competitiveness (Spain).
The Conversation

This article was originally published at The Conversation.
Read the original article.

Editor's note: For a discussion of the potency of methane compared to carbon dioxide, see the post Methane in the Arctic.

Tuesday, October 16, 2012

Albedo change in the Arctic threatens to cause runaway global warming

Mark Flanner et al. calculated in 2011 that snow and ice on the Northern Hemisphere had a combined cooling effect of 3.3 Watts per square meter (of which 2 W/sm relates to the snow cover on land and 1.3 W/sm to the sea ice).

This cooling effect is deminishing rapidly, as temperatures rise and snow and ice cover declines. Snow and ice on the Northern Hemisphere had already declined substantially over the years and was reflecting 0.45 watts less energy per square meter in 2011 than it did in 1979 (Flanner, 2011).

As discussed in Albedo change in the Arctic, Professor Peter Wadhams calculates that the loss of the Arctic sea ice cooling effect alone can be compared to the net global warming caused by people's emissions (1.66 W/sm, IPCC, 2007b).
From: sites.google.com/site/arctischepinguin/home/piomas

The exponential trends added by Wipneus to PIOMAS Arctic sea ice volume data show that the Arctic Ocean looks set to be ice-free from 2015 onwards for the period from August through to October, while July and November look set to follow from 2017, respectively 2018 onwards with June following closely thereafter. In other words, we could soon face an Arctic Ocean that is ice-free for half the year.

Snow cover on land takes up an even larger area than sea ice. The chart below illustrates the decline of snow cover on land in the Northern Hemisphere (without Greenland) for the month June.


What trends could fit these data? On the image below, I've added trendlines and I encourage others to come up with better ones.

Clearly, a lot of snow and ice looks set to disappear over the next few years. Note that what happens in winter doesn't matter as much, as little sunlight reaches the Arctic in winter. What matters most is how much sunlight is reflected when insolation in the Arctic is high. Insolation during the months June and July is higher in the Arctic than anywhere else on Earth, as shown on the image below, by Pidwirny (2006).


While Greenland remains extensively covered with snow and ice, the reflectivity of its cover shows rapid decline, as illustrated by the image below. The July data since 2000, from the meltfactor blog with projection in red added by Sam Carana, suggest a exponential fall in reflectivity that looks set to go into freefall next year.
From: Greenland is melting at incredible rate

Albedo: wikipedia.org/wiki/Albedo

A drop of as little as 1% in Earth’s albedo corresponds with a warming roughly equal to the effect of doubling the amount of carbon dioxide in the atmosphere, which would cause Earth to retain an additional 3.4 watts of energy for every square meter of surface area (NASA, 2005; Flanner et al., 2011).

Combined, the snow line retreat, loss of sea ice and decline of Greenland's reflectivity constitute a huge loss of summer cooling in the Arctic.

As a result, summer temperatures in the Arctic look set to rise rapidly over the next few years, threatening to unleash massive amounts of methane from sediments below shallow waters of the Arctic Ocean, spiraling Earth into runaway global warming.

If you are also concerned about this development, please share the image below at Facebook, with a link to this post.


References
- Albedo - Wikipedia
wikipedia.org/wiki/Albedo

- Albedo change in the Arctic
arctic-news.blogspot.com/2012/07/albedo-change-in-arctic.html

- Flanner et al. (2011), Radiative forcing and albedo feedback from the Northern Hemisphere cryosphere between 1979 and 2008.
nature.com/ngeo/journal/v4/n3/full/ngeo1062.html

- Flanner et al. (2011), Presentation October 27, 2011, WCRP Open Science Conference
wcrp-climate.org/conference2011/orals/B11/Flanner_B11.pdf

- Greenland is melting at incredible rate
arctic-news.blogspot.com/2012/07/greenland-is-melting-at-incredible-rate.html

- NASA, 2005 (at Archive.org)
archive.org/details/albedo_ceres_mar05

Pidwirny, M. (2006). "Earth-Sun Relationships and Insolation". Fundamentals of Physical Geography, 2nd Edition
physicalgeography.net/fundamentals/6i.html

- PIOMAS monthly average sea ice volume, with exponential trends added
sites.google.com/site/arctischepinguin/home/piomas

- Snow Climate Lab, Rutgers University
climate.rutgers.edu/snowcover

Sunday, October 14, 2012

Glaciers cracking in the presence of carbon dioxide

Northern Hemisphere snow and ice map , October 14, 2012 (credit: NSIDC, NOAA)

Snow covers more than 33% of lands north of the equator from November to April, reaching 49% coverage in January. The role of snow in the climate system includes strong positive feedbacks related to albedo and other, weaker feedbacks related to moisture storage, latent heat and insulation of the underlying surface, which vary with latitude and season (IPCC, 2007a8).

Albedo or reflectivity of surfaces
wikipedia.org/wiki/Albedo
Ice caps and glaciers cover 7% of the Earth—more than Europe and North America combined—and are responsible for reflecting 80–90% of the Sun’s light rays that enter our atmosphere and maintain the Earth’s temperature7. They are also a natural carbon sink, capturing a large amount of carbon dioxide7.

Snow and ice on the Northern Hemisphere has a cooling effect of 3.3 watts per square meter, peaking in May at ~ 9 watts per square meter. Snow and ice on the Northern Hemisphere has declined over the years and is now reflecting 0.45 watts less energy per square meter than it did in 1979 (Flanner, 2011). As discussed in Albedo change in the Arctic, this compares to warming of 1.66 watts per square meter for the net emission by people (IPCC, 2007b9).

A recent press release7 announced that researchers from the Massachusetts Institute for Technology have shown that the material strength and fracture toughness of ice are decreased significantly under increasing concentrations of carbon dioxide molecules, making ice more fragile and making ice caps and glaciers more vulnerable to cracking and splitting into pieces.

“If ice caps and glaciers were to continue to crack and break into pieces, their surface area that is exposed to air would be significantly increased, which could lead to accelerated melting and much reduced coverage area on the Earth,” said lead author of the study Professor Markus Buehler.

Buehler, along with his student and co-author of the paper, Zhao Qin, used a series of atomisticlevel computer simulations to analyse the dynamics of molecules to investigate the role of carbon dioxide molecules in ice fracturing, and found that carbon dioxide exposure causes ice to break more easily.

Notably, the decreased ice strength is not merely caused by material defects induced by carbon dioxide bubbles, but rather by the fact that the strength of hydrogen bonds—the chemical bonds between water molecules in an ice crystal—is decreased under increasing concentrations of carbon dioxide. This is because the added carbon dioxide competes with the water molecules connected in the ice crystal.

It was shown that carbon dioxide molecules first adhere to the crack boundary of ice by forming a bond with the hydrogen atoms and then migrate through the ice in a flipping motion along the crack boundary towards the crack tip.

The carbon dioxide molecules accumulate at the crack tip and constantly attack the water molecules by trying to bond to them. This leaves broken bonds behind and increases the brittleness of the ice on a macroscopic scale7.

A drop of as little as 1% in Earth’s albedo corresponds with a warming roughly equal to the effect of doubling the amount of carbon dioxide in the atmosphere, which would cause Earth to retain an additional 3.4 watts of energy for every square meter of surface area (NASA, 200510; Flanner et al., 2011b6).

Below, a video by Dr. Peter Carter4, showing loss of snow and ice albedo on the Northern Hemisphere from 1997 to 2009, using NOAA images, and also showing the relationship to global food security and Arctic methane.


Sources:
  1. Albedo - Wikipedia
    wikipedia.org/wiki/Albedo
  2. Albedo change in the Arctic
    arctic-news.blogspot.com/2012/07/albedo-change-in-arctic.html
  3. Carbon dioxide enhances fragility of ice crystals
    by Zhao Qin and Markus J Buehler 2012
    Journal of Physics D: Applied Physics Volume 45 Number 44
    iopscience.iop.org/0022-3727/45/44/445302
  4. Carter, P., Northern hemisphere loss of snow and ice albedo cooling
    youtube.com/watch?v=-18xi1hQXNc
  5. Flanner et al. (2011a), Radiative forcing and albedo feedback from the Northern Hemisphere cryosphere between 1979 and 2008, Flanner et al.
    nature.com/ngeo/journal/v4/n3/full/ngeo1062.html
  6. Flanner et al. (2011b), Presentation October 27, 2011, WCRP Open Science Conference
    wcrp-climate.org/conference2011/orals/B11/Flanner_B11.pdf
  7. Glaciers Cracking - Press Release
    cms.iopscience.iop.org/alfresco/d/d/workspace/SpacesStore/bf99f6c7-1386-11e2-bc48-4d5160a0f0b4/Glaciers_cracking_press_release
  8. IPCC 2007a, Climate Change 2007: Working Group I: The Physical Science Basis
    ipcc.ch/publications_and_data/ar4/wg1/en/ch4s4-1.html
    ipcc.ch/publications_and_data/ar4/wg1/en/ch4s4-2.html
  9. IPCC 2007b, Changes in Atmospheric Constituents and in Radiative Forcing, IPCC (2007)
    ipcc.ch/pdf/assessment-report/ar4/wg1/ar4-wg1-chapter2.pdf
  10. NASA, 2005 (at Archive.org)
    archive.org/details/albedo_ceres_mar05
  11. NSIDC, NOAA - Northern Hemisphere snow and ice map
    nsidc.org/data/g02156.html

Saturday, October 13, 2012

Radio and Laser Frequency and Harmonic Test Ranges for the Lucy and HAARP Experiments and their Application to Atmospheric Methane Destruction

by Malcolm P.R. Light
October 7th, 2012

Introduction


Methane is now being expelled into the Arctic atmosphere by the subsea methane hydrates at a fast increasing rate and that this expulsion began in earnest in August 2010 (Figure 1; Arctic atmospheric methane concentrations at ca 7 km altitude - Yurganov 2012; Carana 2011 a,b,c; 2012 a,b; Light 2002 a,b; 2011 a,b,c; 2012 a,b,c; Light and Carana 2011). The methane is rising into the stratosphere and mesosphere where some of it is being oxidised to produce larger quantities of noctilucent clouds between 76 and 85 km altitude. These noctilucent clouds were seen north of Norway but are now occurring at much lower latitudes over Colorado. An early figure from NASA indicates that noctilucent clouds were originally confined to the southern polar regions (Figure 2).

Prof. James Russel of Hampton University argues that the build up of methane in the atmosphere is the reason for the increase in noctilucent clouds. Prof Russel says that "When methane makes its way into the upper atmosphere it is oxidised by a complex series of reactions to form water vapour. This extra water vapour is then available to grow ice crystals for noctilucent clouds". Therefore if we succeed in breaking down the methane in the stratosphere and mesosphere using the HAARP - IRIS (Ionospheric Research Instrument) using the 13.56 MHz methane destruction frequency it could lead to an increase in noctilucent cloud formation in a circular zone directly above the HAARP transmitters which could be detected by optical cameras or radar. The HAARP tests should be conducted in the summer when the temperatures are at their lowest in Alaska (140o to 160o Kelvin) increasing the chances of noctilucent cloud formation from the radio frequency oxidised methane. The HAARP IRIS transmitters normal frequency range is from 2.8 MHz to 10 MHz (Wales 2012). If for example a 10 MHz carrier wave is modulated by a 3.56 MHz signal it will produce and Upper Side Frequency of 13.56 MHz the required methane destruction frequency and a Lower Side Frequency of 6.44 MHz (see Table 3)(Penguin Dictionary of Physics, 2000)

NASA modelling shows a wide equatorial band of stratospheric methane reaching 1.8 ppmv, much higher than occurs in the troposphere indicating that the methane is rising up into the stratosphere where it is now accumulating and it will soon form a continuous global warming veil causing extreme heating of the Earth's surface by trapping the suns heat below it (Figure 3)(Light 2011c).
The problem is that the methane being released into the Arctic atmosphere from destabilization of the submarine methane hydrates has an extremely high global warming potential compared to carbon dioxide, close to 100 times for the first 15 years of its life (Wales 2012; Dessuse et al. 2008). Hence a methane concentration of 2 ppmv is approximately equivalent to adding 200 ppmv of carbon dioxide to the atmosphere, i.e. multiplying the present carbon dioxide content by 1.5. But 2 ppmv is only 2 ten thousands of a percent of methane and you need about 15 percent of methane in the air for it to burn (Wales 2012). Therefore you cannot burn these giant clouds of methane erupting into the Arctic atmosphere and they are rising so fast through the troposphere into the stratosphere that they become impossible to deal with without some action at a distance method such as radio waves or laser. We could of course try to get chemicals up there and into the Arctic but that would lead to even more pollution in the long run. Vibrating the ionosphere at the correct methane destruction radio frequency using HAARP may help to oxidise some of the methane throughout the entire stratosphere and troposphere but more localised radio/laser destruction of the rising methane clouds will also be required if we are going to make any dent at all in the volume of methane that is now being released into the atmosphere from the Arctic ocean.

We are dealing with oceanic methane being released in increasing quantities into the atmosphere from destabilised methane hydrates over which we have no control at all and once it is in the air and in the stratosphere we presently have no way to break it down. This Stratospheric methane reservoir is going to increase in density, thickness and extent until it encompasses the entire Earth and will eventually cause catastrophic global warming and the extinction of all life on earth (Light 2011c). Furthermore because the methane remains mostly in the stratosphere, it is not recorded when average atmospheric compositions are determined at Mauna Loa and other locations so we don't know how much is up there yet (Light 2011c). When the German-French Merlin Lidar methane detecting satellite is launched in 2014 we should have a better idea of the methane distribution from the surface to 50 km altitude.

When the Arctic ice cap melts towards the end of 2015 there will be a massive increase in the amount of heat being absorbed by the Arctic ocean from the sun. Tthe Gulf Stream which presently feeds the Arctic with Atlantic water along the west side of Svalbard and through the Barents Sea is normally cooled when it hits the floating ice pack and this will cease to happen bringing even vaster amounts of Atlantic heat via the Gulf Stream into the Arctic. Consequently the Arctic subsea methane hydrates will destabilize at an even faster rate because of the increasing Arctic ocean temperature pouring methane into the Arctic atmosphere and stratosphere (Light 2011c, Light 2012a, b).

The extreme weather events in the United States this year which included record heating and drought conditions, massive loss of food crops with farmers going bankrupt, more hurricane flooding in New Orleans and tornadoes in New York is just a small sample of what will come in the next four or five summers as the Arctic ice finally melts. The Arctic ice cap works like the Earths air conditioner because of the latent heat of melting and freezing of the floating ice and its effect on moderating atmospheric temperatures.

An extensive stratospheric methane warming veil is spreading over the United States and is undoubtedly the reason for the extreme weather events and very high temperatures. The livelihoods of all the American people are going to be totally compromised in the next few years unless we develop a system of destroying the atmospheric methane that is erupting in the Arctic from the destabilization of submarine methane hydrates and is accumulating as a global warming veil in the stratosphere and mesosphere

We are facing impossible odds with regard to the Arctic ocean methane release and in the same way that Colonel Travis drew a line at the Alamo to ask for volunteers to help him defend the mission against Santa Ana's massive Mexican army, I am drawing a virtual line through the snow on the top of the Arctic ice pack to ask for volunteers to defend the American people from the fast gathering Arctic methane global firestorm. We desperately need dedicated scientists and engineers to volunteer to develop an effective "action at a distance" method of destroying the Arctic oceanic methane clouds as they are erupting from the sea surface and entering the stratosphere and mesosphere. If the United States can land giant rovers on the mars with a sky crane, surely American engineers and scientists are up to this challenge. We need to get rid of as much of this atmospheric methane as we can to drop the polar temperatures to reasonable levels. This will of course have to go hand in hand with a massive cut back in carbon dioxide emissions from all developed and developing countries.


The Technology

Methane in the air may be decomposed between two radio transmitters where the two radio beams intersect one another at right angles within the atmospheric methane cloud such as in Figure 4 (Table 3). In this system one of the frequencies of the two transmissions is 10 MHz and the other 23.56 MHZ which generates a beat frequency of 13.56 MHZ, the required frequency to break down the first C-H bond in the methane molecule.

If the ratios of the transmitted frequencies are 1:2, 1:3, 2:3 or 3:4, planar cross shaped harmonics are generated in the interference pattern (Ashton 2001) generated by the two transmitters which are at right angles and this should lead to increased destruction of the methane molecule because its four hydrogen bonds can be viewed as forming a cross (Figure 4).
Another method of destroying the atmospheric methane clouds is for three transmitters to be situated on the corners of an equilateral triangle and the correct distance apart so that their three transmission beams intersect exactly at right angles in space within the methane cloud we are wanting to decompose (Figure 5). These three transmitters set up an interference pattern which is a cube of the original linear transmission beams (Figure 5). Accordingly, the three transmitters and the intersection point form a three dimensional interference figure (Figure 5).


Each 27.12 MHz beam has energy some 5.77 times as much and a 54.24 MHZ beam has energy some 11.54 times as much as the amount of energy required to break the first C-H bond in the methane molecule.

The resonance of the fundamental Degenerate Deformation (e)/ (3 power 10) vibration on the C - H bond with the 13.56 MHz harmonic in concert with the compression and extension of the methane H - H separation by the fundamental Synthetic Stretching resonance/ (3 power 9) will grow until one of the methane C - H bonds breaks eliminating the methane molecule from the global warming equation. This process will be enhanced by the generation of a three dimensional cross - shaped radio frequency ( (4:2, 3:2, 3:1,2:1) interference pattern in the methane clouds by using three transmitters separated such, that the three radio beams intersect one another exactly at right angles (Figures 5 and 6).

Project Lucy aims to design, build and test a microwave and laser transmission system targeting low-altitude methane clouds, while the HAARP experiment will target stratospheric methane clouds with the aim of breaking down the first C - H bond as soon as the methane erupts from the Arctic ocean into the atmosphere (Light and Carana, 2012) (Figure 7). Methyl group gases and oxygen and ionized hydrogen are released from the methane and water and the hydrogen will rise into the troposphere and stratosphere and combine to form H2.

One of the more complex radio and laser frequency methane destruction systems can be set up by three transmitters arranged in an equilateral triangle so that they set up a cubic interference pattern within the rising methane cloud (Figure 7). The transmitters can be mounted on submarines, planes and after 2015 on boats and drilling rigs when the Arctic ice cap has completely melted (Arctic News, 2012).


In this system each of the three radio transmitters will have a linked Lidar atmospheric methane detection laser with a 50 km effective range continuously scanning the 3D radio interference pattern ahead of a methane heating laser similar to the laser system designed for the Merlin satellite (see Ehret 2012 and Lidar lasers in this article). The leading methane detection laser (Ehret 2012) and lagging methane heating laser (Sternowski 2012) will be aimed subparallel to the (13.56 MHz; 27.12 MHz; 40.68 MHz or 54.24 MHz) radio transmission beam and they will scan the entire face of the cubic interference pattern in a repetitive sequence similar to an electron gun on a TV screen. The methane heating laser which will be tuned to the fundamental and degenerate methane bending and stretching frequencies (V1 - V4) (Boudon 2012; Sternowski, 2012) and will be oriented subparallel to the atmospheric methane detection laser but will scan slightly behind it.

The 9 radio and laser transmission systems will be linked via a geostationary satellite to a neural net computer system at a base station which will continuously monitor the methane content in the cloud (as well as wind direction and speed?) and automatically adjust the frequencies, polarizations, phase shifts and beam directions of all three separate transmitter arrays to achieve maximum methane destruction at all times.

We can imagine that the methane molecules will be spinning in the rising Arctic atmospheric methane cloud and at some moment in time, a portion of them will have one of their four hydrogen protons located at the top as shown in Figure 8. If we then imagine three in phase electromagnetic (EM) transmissions advancing parallel to the upper three sides of the methane tetrahedron with a relative wavelength equal to about 1.7751 Angstroms (10^-10 meters) and that these three waves sum at the crest of the spinning methane molecule, they should eject the positive methane proton from repulsion when they synchronously pulse positive. This process should work to a lesser degree for any larger wavelength harmonics of the H - H spacing EM wavelength assumed in this example so long as the three transmissions are exactly in phase and help break the "Perfect Diamond Cleavage Surface" zone of weakness in the methane molecule which is situated at half the H - H spacing (see Figures 6 and 8). For this system to be most effective the three transmission systems should be located at the lower three corners of an equilateral triangle of a tetrahedron as shown in Figures 5 and 8.

Yet another way of destabilizing the upper hydrogen proton in a spinning methane molecule is by circular polarization of one of the three in phase EM transmissions (Figure 9). When these three EM transmissions sum at the top of the spinning methane molecule they will eject the upper hydrogen proton as they synchronously pulse positive assisted by a circular polarization torque on the proton which will try to rotate it toward the adjacent positive proton field (Figure 9). Circular polarization of the EM transmissions could also increase the rate of spin of the methane molecules thus increasing the centrifugal force and making the C - H bonds weaker.

Effective Radiated Power (ERP) of electromagnetic (EM) systems is a standard theoretical measurement of radio frequency (RF) energy and is determined by subtracting system losses and adding system gains (Wales, 2012). Additional energy will be required for the third circularly polarized transmitter because circular polarization reduces the strength of the Effective Radiated Power (ERP) by about a half (Wales, 2012). The same applies to transmissions where there is an equal split between horizontal and vertical polarization which cuts the reported Effective Radiated Power (ERP) in half (Wales, 2012).

An additional laser system could be connected to the Lidar - laser atmospheric methane detection and methane heating lasers to also detect wind motion and direction within the methane cloud using a doppler (frequency shift) system (Ehret, 2012). This wind speed and direction detection system could be used to adjust the strength and direction of the radio and laser transmission network to compensate for increases or decreases in the methane input due to wind velocity changes.

In this case the complete transmission system would involve three radio transmitters, three wind speed/direction lasers, three Lidar atmospheric methane detection lasers and three methane heating lasers which will energise the fundamental and degenerate bending and stretching modes of the methane molecule, 12 transmitters in all.

Side Frequencies 

When a carrier wave of frequency fn is modulated by a sinusoidal frequency fm (where fm is very much smaller than fn), the composite wave consists of three separate components which have the following frequencies:-

1...... fn
2...... fn + fm (The Upper Side Frequency)
3...... fn - fm (The Lower Side Frequency)

fn - fm is equivalent to a beat frequency or to a difference tone when it exceeds 20 beats per second (Penguin Dictionary of Physics, 2000).

Laboratory methane destruction experiments have shown that a frequency of 27.12 MHz gives a higher rate of methane conversion than the 13.56 MHz frequency which is normally used (Shiryaev et al. 2006).

If the Upper Side frequency (fn + fm) is twice the value of the Lower side frequency (fn - fm) then we can let:-

(fn + fm) = 2 (fn - fm) = 2fn - 2fm
Therefore fn = 3fm

If we let fn = 20.34 MHz
             fm = fn/3 = 6.78 Mhz

Then (fn + fm) = (20.34 + 6.78) MHz = 27.12 MHz
                       = 2*13.56 MHz

and (fn-fm) = (20.34 - 6.78) MHz = 13.56 MHz

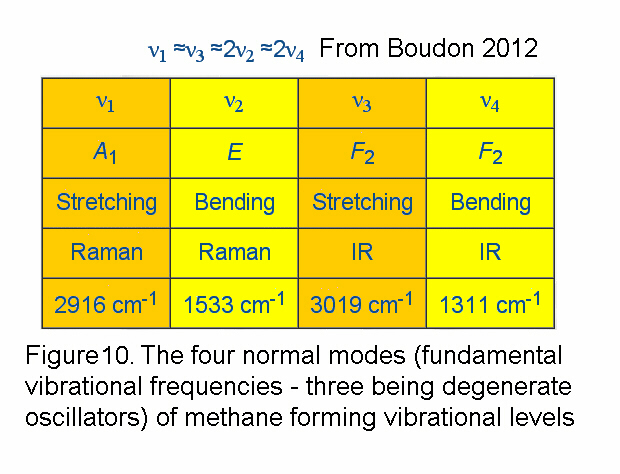
Methane Fundamental Vibration Levels

Methane shows four normal modes of molecular vibration (Figure 10; Boudon 2012; Lide and Frederickse, 1995)

The primary fundamental vibration frequency is V1 (A1), a symmetrical stretching of the C - H bonds in the methane molecule which has a wavenumber of 2916 cm-1 (wavelength of 3.4294 microns)(Boudon 2012). The wavenumber of V1 was estimated earlier at 2917 cm-1 (Lide and Frederickse, 1995).

The V2(E, e) vibration frequency is a bending frequency of the C - H bonds in the methane molecule and forms a degenerate oscillator with a wavenumber of 1533 cm-1 (wavelength 6.5232 microns)(Boudon, 2012). A previous estimate of the V2 wavenumber was 1534 cm-1 (Lide and Frederickse, 1995).

The third fundamental frequency V3(F2, f) is a degenerate stretching oscillation of the methane C - H bonds with a wavenumber of 3019 cm-1 (Boudon, 2012; Lide and Frederickse, 1995).

The fourth fundamental frequency V4 (F2, f) is a bending frequency of the methane C- H bonds which also forms a degenerate oscillator with a wavenumber of 1311 cm-1 (wavelength 7.6277 microns)(Boudon 2012). Earlier estimates fixed V4 at a wavenumber of 1306 cm-1 (Lide and Frederickse, 1995).

The wavenumbers of the symmetrical stretching V1 and the degenerate stretching V3 are about the same and are approximately twice the values of the V2 and V4 degenerate deformational bending of the C - H bonds in the methane molecule (Figure 10; Boudon 2012). V1 and V2 are in the Raman range and V3 and V4 in the Infra Red range (Boudon 2012). These four vibration frequencies form a vibration structure with many vibration levels which are grouped into polyads (Figure 11; Boudon 2012).


All four of the fundamental vibration frequencies can be energised in methane molecule by lasers. These fundamental frequencies are:-

   Wavenumbers                             Wavelengths

V1   2916 cm-1  291600 m-1             3.429μ    3429 nm
V2   1533 cm-1  153300 m-1             6.523μ    6523 nm  
V3   3019 cm-1  301900 m-1             3.312μ    3312 nm
V4   1311 cm-1  131100 m-1             7.628μ    7628 nm   

The methane symmetrical and degenerate C- H bond stretching vibration frequencies V1 and V3 can be excited by tunable semiconductor lasers (Cd(1-x) Hg(x) Te and In As(1-x) Sb(x)), color center lasers (Rb Cl:Li) and possibly Neon lasers (Figures 12 and 13; Krupke in Lide and Frederikse, 1995).


The methane degenerate C - H bond bending deformations V2 and V4 can be excited by tunable carbon monoxide molecular lasers and semiconductor lasers (Cd(1-x) Hg(x) Te and Pb S(1-x) Se(x)) (Figures 12 and 13; Krupke in Lide and Frederikse, 1995). The Cd(1-x) Hg(x) Te semiconductor laser can be tuned to all four methane fundamental vibration wavelengths while the bending vibrations are also well covered by tunable carbon monoxide lasers (Figure 13; Krupke in Lide and Frederikse, 1995).


Atmospheric Methane Detection and Wind Speed/Direction Lasers

The methane detection Lidar laser system to be used in the Lucy Project will need to incorporate the abilities of the Merlin Satellite Lidar methane detection system described by Ehret (2010) and Millet and Alpers (2010). This will include an ability to detect atmospheric methane concentrations over a distance of some 50 km in the Earth's atmosphere and possibly simultaneously develop a wind profile from the measurement of frequency changes (Ehret, 2000). The wind laser systems send intense laser pulses through the atmosphere which are scattered back from distant particles and molecules, analysed as a function of time and frequency and the wind direction and speed are determined from the doppler frequency shift (Ehret 2010).

The atmospheric methane detecting and wind speed/direction lasers in the Lucy Project will scan the methane cloud ahead of the methane fundamental vibration excitation lasers and will be linked in real time via a geostationary satellite to a controlling base station with a computer neural network (Figure 7). The base station computer will thus be able to monitor and predict changes in the atmospheric methane concentration and adjust the direction, strength, frequency, phase shifts and polarizations of the radio and laser transmitter systems to achieve maximum methane destruction (Figure 7).

The email addresses of staff who could be contacted about the details of the Lasers and work at the Merlin Satellite and the LIDAR methane detection system at the Deutches Zentrum für Luft - und - Raumfahrt (DLR), Institut fur Physik der Atmosphäre are listed below:-

Prof. Dr. Martin Dameris - Martin.Dameris@dlr.de
PD. Dr. rer.nat. Veronika Eyring - http://www.dlr.de/pa
Dr. rer. nat. habil. Dietrich Heimann - d.heimann@dlr.de
Dr. Hans Volkert - Hans.Volkert@dlr.de
Dr. rer. nat. Gehard Ehret - http://www.dlr.de/pa
DLR: Dr Matthias Alpers - matthias.alpers@dlr.de
CNES:Bruno Millet - bron.millet@cnes.fr

The following section is taken directly from a description by Millet and Alpers (2010) and Ehret (2010) on the characteristics of the atmospheric methane detection lasers to be mounted on the MERLIN satellite (Doc.Ref.No. MLN-SYS-MEMO-10015-DLR CNES - De l'espace pour la Terre. DLR).
_______________________________________________________________________

Methane Integrated Path Differential Absorption (IPDA) LIDAR
(Light Detecting and Ranging) Atmospheric Methane Detecting Laser

The Methane LIDAR instrument (Light Detection and Ranging, sometime referred to as 'light radar') transmits pulses of light towards Earth, and then receives the radiation that is reflected back from Earth's surface, again in pulse form. Whenever one of these pulses encounters Methane, its signal strength is reduced and the instrument detects this reduction. The instrument send its laser beam to and from the Earth 24 times a second. With the measured values, a world map showing atmospheric Methane concentrations can be produced and also regional differences can be highlighted.

Global information on atmospheric Methane concentration (Methane column density) with an accuracy better than 2% and with a spatial resolution of 50 km along track also under cloudy and variable sun illumination conditions.

Differential absorption of gaseous methane at two laser wavelengths reflected from Earth surface or dense clouds.

Observation Method:

Differential absorption of gaseous methane at two laser wavelengths reflected from Earth surface or dense clouds.

LIDAR (Light Detecting and Ranging): 

"Active" optical remote sensing instrument for atmospheric parameters or trace gases. Main components are (1) two pulsed high power laser emitters, (2) a telescope to receive the laser light backscattered from atmosphere or Earth surface, (3) a sensitive photon detector.

IPDA (Integrated Path Differential Absorption):

Determination of total Methane column density between satellite and Earth surface or cloud top height. The Methane amount is calculated from different absorption at two laser wavelengths (on-line (λon) and off-line (λoff)), reflected on Earth surface or cloud top. Earth surface or cloud top reflected laser light is used because this is much more intense than backscattered light from aerosol particles in the atmosphere. The attenuation due to atmospheric Methane absorption is strong at the on-line wavelength. The off-line "reference" wavelength is selected to be only marginally affected by Methane absorption.

Instrument Concept

Type: Integrated Path Differential Absorption LIDAR (D)
Pointing: 1- 2o off nadir, across track
Emitter: pulsed high power laser with about 24 Hz. rep.rate
(12 Hz double pulse, λon & λoff each), approx. 9 mJ pulse
energy, mean wavelength 1,645 μm
Receiver: Telescope o690 mm, APD detector
IPDA Lidar instrument power consumption: approx 111 w.

Communication:

S-Band Downlink for housekeeping data and S-Band Uplink for commanding
to CNES-ground station network.
X-Band Downlink for scientific data to CNES-ground station network.

_______________________________________________________________________

The Merlin Lidar methane satellite is only to be launched in 2014. The widespread atmospheric methane eruptions in the Arctic from destabilized methane hydrates shows that by 2014/2015, major global warming induced sea level rise will have begun in earnest and we will have lost our chance to take remedial action. We need to know right now how serious the methane build up in the upper stratosphere is so that governments and oil companies can to react to any perceived emergency.

It is recommended as a an emergency stop gap, that a Lidar methane detection device from DLR be mounted on the International Space Station to give early warning data on the build up of methane in the upper stratosphere and Arctic. This project should be promoted as a vital necessity because of the extreme gravity of the methane eruption problem in the Arctic. A German (Lidar trained) astronaut could be launched to the International Space Station as soon as feasibly possible to mount and run the device. This will also give another calibration of the Lidar methane device at shallower orbital altitudes which will assist the Merlin project. The DLR will need to immediately train a German astronaut on how to mount and run a Lidar methane detecting instrument on the International Space Station. 

HAARP

The main instrument at HAARP Station is the Ionospheric Research Instrument (IRI). This is a high power, high-frequency phased array radio transmitter with a set of 180 antennas, disposed in an array of 12x15 units that occupy a rectangle of about 33 acres (13 hectares). The IRI is used to temporarily energize a small portion of the ionosphere. The study of these disturbed volumes yields important information for understanding natural ionospheric processes."

http://en.wikipedia.org/wiki/High_Frequency_Active_Auroral_Research_Program

The main MHZ frequency range (High Frequency Band 3 - 30 MHZ) of the powerful IRI transmitter is slightly different from the 13.56 MHZ needed to break down the methane. However it is very powerful with a 5.1 Giga watt effective radial power at maximum output. The Ionospheric Research Instrument (IRI) at HAARP transmits over the range 2.8 MHZ to 10 MHZ slightly less than the 13.56 MHZ used to break down methane but as mentioned previously if the IRI transmitted a 10 MHz carrier waves modulated by a 3.56 MHz signal it will generate an Upper Side Frequency of 13.56 MHz which is the methane destruction frequency (Penguin Dictionary of Physics 2000).

Noctilucent clouds which are common in the Arctic form from water condensing around meteorite dust in the mesosphere above 50 km altitude and are becoming more and more abundant and are being seen at much lower latitudes. The increase in the methane concentration in the stratosphere and its oxidation in the mesosphere is resulting in more water at these high altitudes and an increase in the noctilucent clouds. The noctilucent clouds help reflect the suns heat back into space so if we can break down more methane with the HAARP or Lucy transmitters we should generate more clouds and thus help reverse global warming by:-

a) Getting rid of the high global warming potential methane at low altitudes and in the stratospheric global warming veil.

b) Generating sunshine reflecting noctilucent clouds in increasing amounts in the mesosphere which will reflect the suns energy back into space.

The HAARP facility has discovered what they call Polar Mesosphere Summer Echoes which are elusive phenomena which may be due to a thicker development of noctilucent clouds in the Arctic summer due to the increasing methane build up. These echoes are detected with the IRI transmitter when it is used as a radar with one 28 MHZ radar and two other VHF radars of 49 MHZ and 139 MHZ. If we could transmit 13.56 MHZ on the IRI transmitter and use the other radars and optical cameras to look for reflections from noctilucent clouds formed from the breakdown of methane in a circular zone above the HAARP transmitter we should be able to effectively test the system. There ought to be a buildup of the noctilucent clouds in the area where the HAARP transmissions are focused on the ionosphere. If it works there are 4 other similar facilities in the world (Hipas, Alaska; Arecibo, Puerto Rico, EISCAT, Norway and Sura, Russia) where they could immediately attack the atmospheric methane as well.

HAARP Contacts, 2012.
John Hechscher, Director, HAARP, Gakona, Alaska
haarp.alaska.edu

377th Airforce Base Wing Public Affairs, 2000 Wyoming Blvd SE, Suite A1, Kirkland Air Force base, NM, 87117

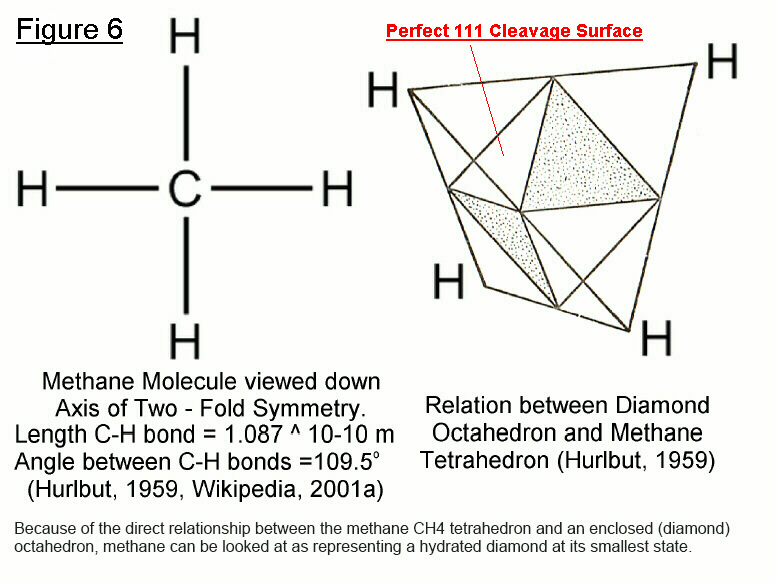
Comparison of the Molecular Structures of Methane and Diamond

A detailed study was made of the molecular distances in methane and diamond molecules and their similarities and differences in order to determine what radio wavelengths would effectively operate on the destruction of the first C - H bond in the methane molecule and where the weakest zone exists within the structure of the methane molecule (see Table 1 and Figures 14 to 24). In addition, the relationship to the fundamental methane stretching and bending vibrations and methane destruction radio frequencies was also determined. The different molecular distances are numbered in Table 1 and can be directly found with the same number on the Figures 14 to 24.


Because of a perfect relationship between the diamond octahedron and the methane tetrahedron (Hurlbut, 1959), the methane can be looked upon as representing a hydrated diamond at its smallest state (Figure 6). Diamond has only one perfect 111 (and 1, bar1, 1) cleavage surface along which it preferentially breaks (Figure 6). Because the methane tetrahedron encloses a diamond shaped octahdedron whose vertices intersect the H - H spacing exactly at the centre, a perfect 111 equilateral triangular cleavage surface exists beneath each of the hydrogen protons at a half H - H spacing. This perfect 111 cleavage surface must represent a zone of weakness in the methane molecule which will allow the hydrogen protons to be dislodged from the methane molecule by stretching or bending the C - H bond or applying a torque to it due to the effects of radio and laser electromagnetic waves (Figure 6).

A methane destruction frequency (RFT) of 13.56 MHz has a wavelength of 22.1085 meters. The methane destruction (RFT) wavelength divided by (3*2^36) is 1.0724 Angstroms (10^-10 meters) (RFT/A) and has been compared to the various molecular distances in the methane and diamond molecules. RFT/A is very similar to the methane C - H bond length of 1.087 Angstroms (10 power -10 meters) in the methane molecule (approximately 0.9865 of the value) (number 5 on Table 1). RFT/A is approximately 0.9819 of the value of the height of the 111 equilateral face side of the diamond 1/8 subcell = 1.0922 Angstroms (10 power -10 meters) (number 23 on Table 1).

The frequency calculated from the height of the methane tetrahedron (number 8. - 1.25516*10 power -10 m) is closely related to the V2 bending degenerate deformation (wavenumber 1533 cm-1) and the 27.12 MHz methane destruction frequency. The ratio of the V2 bending frequency to the methane tetrahedron height frequency*3/(2 power 22) is 26.9192 which is very close to one millionth of the 27.12 MHZ methane destruction frequency (approximately 0.9926 of the value).

Excel Table 2, Sheet 1 of Excel Table 2,3 and 4

Excel Table 2 shows the various harmonics of the 3 to 300 THz Electromagnetic Band (part μm waves, part infra red) which includes the four methane fundamental stretching and bending frequencies. Table 2 is found as Sheet 1 of Excel Table 2,3 and 4.


The four methane molecular vibrations, V1(A1) - symmetrical stretching (wavenumber 2916 cm-1), V2 (E,e) degenerate bending deformation (wavenumber 1533 cm-1), V3(F2,f), degenerate stretching (wavenumber 3019 cm-1) and V4 (F2,f) degenerate bending deformation (wavenumber 1311 cm-1 ) are taken from Boudon (2012). Boudan (2012) states that V1 and V3 have similar values and they are almost twice the values of V2 and V4. Lide and Frederickse (1995) give slightly different, earlier derived wavenumbers for V1 (2917 cm -1), V2 (1534 cm -1), V3 (3019 cm -1) and V4 (1306 cm -1).

The frequencies of the V2, V3 and V4 methane fundamental vibrations are found to be exact harmonics of the 13.56 MHz methane destruction frequency while the relative harmonic error between V1 and the 13.56 MHZ frequency is 1.85*10 power -7 (Table 2).

Various combinations of V1, V2 and V3 as carrier waves and V1, V2 and V4 as modulation signals with the corresponding Upper and Lower Side Frequencies are shown in Table 2.

The energy necessary to break the first C - H bond in one methane molecule is 7.35*10 power -24 electronvolts. The minimum energy of 0.16 electronvolts is shown by the V4(F2) bending molecular vibration which is 2.2*10 power 22 more than the neregy that is necessary to break of the first C - H bond in the methane molecule (Table 2). The V3 (F2) stretching vibration has a higher energy of 0.37 electron volts which is 5*10 power 22 times the energy that is necessary to break the first C - H bond in the methane molecule (Table 2). The highest energy of 0.73 electronvolts is shown by the Upper Side frequency (V3 + V1) which is 1*10 power 23 times as large as the energy necessary to break the first C - H bond in the methane molecule (Table 2).

The results of a number of possible transmission combinations are shown in Table 2. In the first case, if we have transmission of a single laser frequency such as V2, V3 and V4 from each of the three transmission stations there is a perfect resonance with the 13.56 MHz methane destruction frequency (Table 2). Furthermore the (V3 + V2) Upper Side Frequency and the (V3 - V2) Lower Side frequency also show perfect resonance with the 13.56 MHz interference pattern (Table 2). However there is slight dissonance between the (V2 and V4) and (V3 + V4) Upper Side Frequencies and the (V2 - V4) and (V3 - V4) Lower Side Frequencies with the 13.56 MHz transmission (Table 2).

A second case can be considered where we have transmissions of a carrier wave and a modulation signal laser frequency from each of the transmission stations (Table 2). In the first transmitter the V3 carrier, V2 signal, Upper Side Frequency (V3 + V2) and Lower Side frequency (V3 - V2) give perfect resonance with the 13.56 MHz methane destruction frequency (Table 2). In the second transmitter the V1 carrier has good resonance with 13.56 MHz radio frequency while the V2 modulation, The Upper Side Frequency (V1 + V2) and the Lower Side Frequency (V1 - V2) are in perfect resonance with the 13.56 methane destruction frequency (Table 2). The same situation also applies to the third transmitter where the V1 modulation signal has a good resonance with the 13.56 MHz radio frequency while the V3 carrier, (V3 + V1) Upper Side Frequency and (V3 - V1) Lower Side frequency are in perfect resonance with the 13.56 MHz methane destruction frequency (Table 2). In these three calculations of the transmissions there is perfect resonance between the 13.56 MHz interference pattern and all the Upper Side Frequencies ((V3 + V2), (V1 + V2), (V3 +V1)) and the Lower Side Frequencies ((V3 -V2), (V1 - V2), (V3 - V1)(Table 2).

Electromagnetic Buckling of the Methane C - H Bond

The curvature of a fold or buckle in the methane molecular structure is the reciprocal of the mean radius of curvature of the buckle or fold (Ramsay, 1967). We can look on the wavenumber of V4 bending = 1310.8 cm-1 = 131080 m-1 as a function of the curvature of the methane molecule and its reciprocal, the wavelength of V4 bending (7.6289*10 power -6 meters) as a function of the radius of curvature of the bending. Therefore the relative curvature of the methane molecule due to V4 bending = 131080 m-1 = 9 2/3* 13.56 MHz/1000 = 9 2/3*13.56 KHz.

This means that by increasing the frequency of the exciting EM and radio waves harmonically, we are going to increase the curvature of the methane molecule until such time as a fracture will precipitate along one of the "Perfect Diamond" 111 cleavage surfaces and one of the methane hydrogen protons will be ejected (Figure 5). This will destroy the methane molecule and eliminate it from the global warming equation.

Excel Table 3, Sheet 2, Excel Table 2,3 and 4

Excel Table 3 shows the various harmonics in the High Frequency (HF), ITU, Band No.7 (decameter waves) which include the methane destruction frequencies (13.56 and 27.12 MHz)., the octave (2:1), second overtone (3:1), lateral fifth (3:2) and the fourth (4:3). Table 3 is found as Sheet 2, Excel Table 2,3 and 4.

The energy required to break the first C - H bond in the methane molecule = 7.34896*10 power -24 electronvolts (Table 3). The energy of the HF frequencies ranges from 5.6*10 power -8 to 3.4*10 power -7 electronvolts which is some 7.63*10 power 15 to 4.5*10 power 16 times the required energy to break the first C - H bond in the methane molecule (Table 3).

Radio frequencies have also been calculated for another set of carrier and modulation frequencies from each transmission antennae with Upper and Lower Side frequencies (Table 3). For the HAARP Ionospheric Research Instrument (IRI) Frequency range (2.8 to 10 MHz), a carrier wave of 10 MHz modulated by a 3.56 MHz signal will generate a 13.56 MHz Upper Side Frequency (the methane destruction frequency) and a Lower Side Frequency of 6.44 MHz (Table 3). The Upper Side methane destruction radio frequency of 13.56 MHz has an energy of 5.6*10 power -8 electron volts which is 7.63*10 power 15 times the required energy necessary to break the first C - H bond in the methane molecule (Table 3). The 3.56 MHz modulation signal on the 10 MHz carrier has an energy of 2*10 power 15 times the energy necessary to break the first C - H bond on the methane molecule (Table 3).

Table 3 also shows the calculations for various other frequencies out of the HAARP IRI frequency range which extends from 13.56 MHz to 81.36 MHz (= 6*13.56). The highest energy ratio realized is 3.66*10 power 17 between an Upper Side Frequency of 650.88 MHz and the energy necessary to break the first C - H bond in the methane molecule (Table 3). The Upper Side Frequency is generated by a carrier wave of 433.92 MHz with a modulation signal of 216.96 MHz (Table 3).

Excel Table 4, Sheet 3, Excel Table 2,3 and 4.

Excel Table 4 shows the various harmonic ratios which include octaves, fifths, cubes and squares that the 13.56 MHz and 27.12 MHz methane destruction radio frequencies can be raised to, to test for the highest degree of methane destruction within a rising methane cloud either at HAARP or in a separate Lucy test facility. Table 4 can be found as Sheet 3, Excel Table 2,3 and 4.

The harmonic multipliers have been derived from the triangular harmonic Lambdoma (Table 4)(Ashton, 2001). The square side of the harmonic Lambdoma extends from 1 to 32 and is important because it includes all the numbers and their sums that are intrinsic in the structure of molecular electron clouds and in the numbers of basic charged particles (Table 4) (Lide and Frederick 1995). The cubic side of the harmonic Lambdoma which extends from 1 to 243 gives all the likely cubic multiples that will be generated by three transmission beams intersecting at right angles in an interference pattern within a rising methane cloud (Table 4). This interference pattern will contain cross shaped interference patterns putting the hydrogen protons under stress in the methane molecule and helping to the destroy the first C - H bond (Table 4).

Various combinations of the octaves, fifths, cubes and squares should be tested in a single transmitter, in two transmitters with an intersecting interference field and in three transmissions intersecting at 90 degrees as well as three transmissions along the edges of a tetrahedron intersecting at 60 degrees to determine what combination of transmitters, orientations and frequencies gives the greatest degree of methane destruction (Table 4).


View the full spreadsheet in the window below, or go directly to:
https://docs.google.com/spreadsheet/ccc?key=0ArjFQnAaMpkXdHBjMDE2OXlMU0xad3VhS2JIOW5nVHc


Conclusions

The UN/US must immediately declare an international emergency of the most extreme kind and call for a conference of world governments and oil companies to select the fastest and most efficient way to deal with the Arctic methane eruption threat. The Lucy Project and suggested HAARP experiments are methods of destroying the Arctic atmospheric methane clouds at a distance and will be our first line of defence against the extreme global warming potential of the fast increasing concentration of methane in the atmosphere. The Angels proposal aims to depressurize the Arctic sub seafloor methane in - situ and shut down the methane eruption centres, but it will require massive cooperation between governments and oil companies to achieve its objectives (Light, 2012c). We are already two years past the tipping point in August 2010 when massive subsea atmospheric methane eruptions started in earnest in the Arctic. The next three years are all we have left to try to put a break on the Arctic methane emissions before the heating effects and sea level rise due to loss of Arctic sea ice and Arctic methane induced global warming will be completely unstoppable and humanity will be facing total extinction before the middle of this Century (2050).

I cannot emphasise more how serious the Arctic ocean methane eruption problem is and how little time we have left before its effects on global warming become catastrophic. We need to act now before it is too late.

References

Ashton, A. 2001. Harmonograph. A visual guide to the mathematics of music. Wooden Books, Glastonbury. 58 pp.

Boudon V. 2012. Spectroscopy of Methane. Molecular Spectroscopy and Applications. Department of Optics and Matter-Radiation Interaction. Institut Carnat de Bourgogne (ICB). UMR5209 CNRS-Universite de Bourgogne, Dijon, France.
http://icb.u-bourgogne.fr/omr/SMA/Methane

Carana, S. 2011a. Runaway Warming 2011. Geo-engineering blog
http://geo-engineering.blogspot.com/2011/09/runaway-warming.html

Carana, S. 2011b. Runaway global warming 2011. Geo-engineering blog
http://geo-engineering.blogspot.com/2011/04/runaway-global-warming.html 

Carana, S. 2011c. Runaway Global Warming. In: Climate Change the Next Generation.
http://climatechangepsychology.blogspot.com/2011/04/sam-carana-runaway-global-warming.html

Carana, S. 2012a. Striking increase of methane in the Arctic. In: Arctic News
http://arctic-news.blogspot.com.es/2012/05/striking-increase-of-methane-in-arctic.html

Carana S., 2012b. Record levels of greenhouse gases in the Arctic. Arctic News. Wednesday, May 2, 2012.
http://arctic-news.blogspot.com/2012/05/record-levels-of-greenhouse-gases-in.html

Carana, S. 2011b. Light, M.P.R. and Carana, S. 2011c. Methane linked to seismic activity in the Arctic.
http://arctic-news.blogspot.com/p/seismic-activity.html

Carana S., Oxygenating the Arctic.
http://arctic-news.blogspot.com/p/oxygenating-arctic.html

Carana S., How would you allocate US$10 million per year to reduce climate risk?
http://geoengineering.gather.com/viewArticle.action?articleld=281474979240772

Dessus, B., and Laponche B., Herve le Treut, 2008. Global Warming: The Significance of Methane bd-bl-hlt January 2008.
http://www.global-chance.org/IMG/pdf/CH4march2008.pdf

Ehret G. 2010. MERLIN: French - German climate satellite to be launched in 2014. Deutches Zentrum für Luft - und Raumfahrt (DLR), Institut für Physik der Atmosphäre, Lidar Department.
http://www.dlr.ge/pa/en/desktopdefault.aspx/tabid-2342/6725_read-26662/
Heicklen J. 1976. Atmospheric Chemistry. Academic Press. New York, 406 pp.

Hurlbut, C.S., 1959. Dana's Manual of Mineralogy.
John Wiley and Sons. New York, pp. 609.

Krupke W. F., Characteristics of Laser Sources, in Handbook of Laser Science and Technology, Vol. I, Weber, M. J., Ed., CRC Press, Boca Raton, FL, 1986.
http://203.158.253.140/media/e-Book/Engineer/Chemistry/Handbook%20of%20Chemistry%20and%20Physics/Section%2010/10_18_86.pdf

Lide D.R. and Frederickse H.P.R. 1995. CRC Handbook of Chemistry and Physics. 75th Edition. CRC Press, Boca Raton. 1-1 to 1-33.

Light M.P.R. 2011a. Use of beamed interfering radio frequency transmissions to decompose Arctic atmospheric methane clouds. Edited by Sam Carana.
http://arctic-news.blogspot.com/p/decomposing-atmospheric-methane.html

Light M.P.R. 2011c. Stratospheric methane global warming veil. Edited by Sam Carana. In: Arctic News. http://arctic-news.blogspot.com.au/p/stratospheric-methane-global-warming.html

Light M.P.R., 2012a. Global extinction within one human lifetime as a result of a spreading atmospheric methane heatwave and surface firestorm. Edited by Sam Carana. In Arctic News.
http://arctic-news.blogspot.com/p/global-extinction-within-one-human.html

Light M.P.R., 2012b. How much time is there left to act, before methane hydrate releases will lead to human extinction? Edited by Sam Carana. In: Geo-Engineering.
http://geo-engineering.blogspot.com/2012/02/how-much-time-is-there-left-to-act.html

Light M.P.R. 2012c. Angels Proposal - A Proposal for the Prevention of Arctic Methane Induced Catastrophic Global Climate Change by Extraction of Methane from beneath the Permafrost/Arctic Methane Hydrates and its Storage and Sale as a Subsidized "Green Gas" Energy Source. Light Geomining Solutions, Cortegana, Spain, 49 pp. In: Arctic News.
http://arctic-news.blogspot.com.es/2012/05/proposal-to-extract-store-and-sell.html

Light M.P.R. and Carana, S., 2011. Methane linked to seismic activity in the Arctic. Edited by Sam Carana. In: Arctic News.
http://arctic-news.blogspot.com/p/seismic-activity.html

Light M.P.R. and Solana C., 2002a. Arctic methane hydrates - Mapping a potential greenhouse gas hazard. Abstract and Poster, EGS, Nice. - Appendix at:
http://arctic-news.blogspot.com/p/seismic-activity.html

Light, M.P.R. and Solana, C. , 2002b- Arctic Methane Hydrates: A Potential Greenhouse Gas Hazard
http://adsabs.harvard.edu/abs/2002EGSGA..27.4077L

Ramsay J.G. 1967. Folding and Fracturing in Rocks. Mc-Graw Hill, New York. 562 pp.

Shiryaev, AA., Lakoubovskii, N., Grambole D. and Dubrovinskaia, N. 2006. Spectroscopic study of defects and inclusions in bulk poly- and nanocrystalline diamond aggregates. Journal of Physics. Condensed Matter 18, No 40, L493-L501.

Sternowski, R.H. 2012. Lecture 7. Softronics Ltd.
http://www.softronicsltd.com

The Penguin Dictionary of Physics 2000. 3rd Edition., Market House Books Ltd., Penguin Books, London. pp. 504.

Wales J. 2012. Wikipedia
- Effective Radial Power 
http://en.wikipedia.org/wiki/Sea_level

Yurganov, L., 2012a. Atmospheric Infrared Sounder (AIRS) data from NASA's Aqua Satellite. Index of/pub/yurganov/methane/MAPS/ 
ftp://asl.umbc.edu/yurganov/methane/MAPS/

Yurganov, L., 2012b. Atmospheric Infrared Sounder (AIRS) data from NASA's Aqua Satellite.
ftp://asl.umbc.edu/pub/yurganov/methane/AIRS_CH4%20_2002-2012.jpg